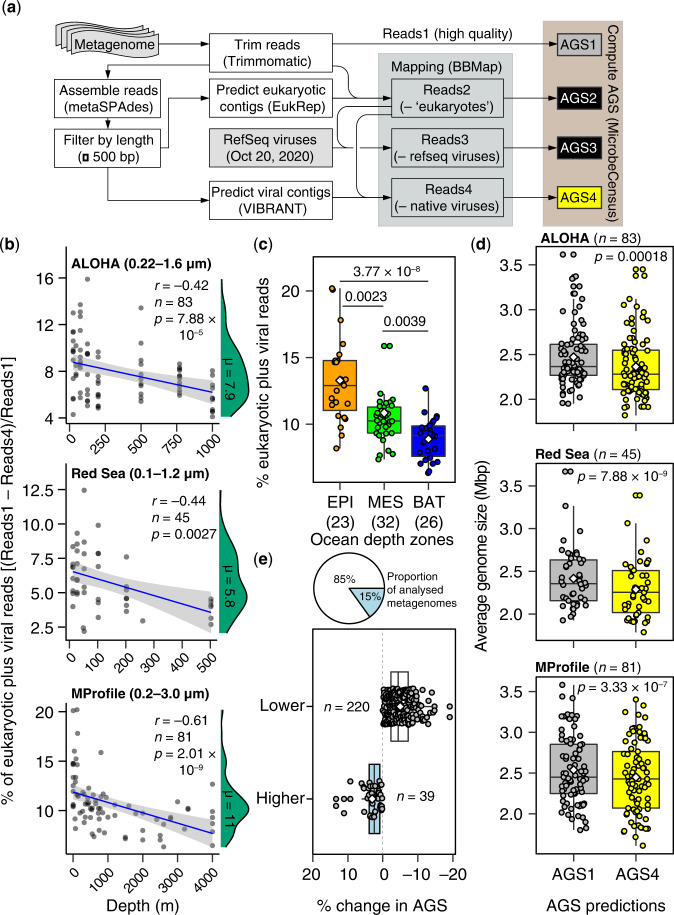
Fig. 1. Eukaryotic and viral metagenomic reads bias AGS estimates in marine microbial metagenomes.
a Schematic workflow of procedures used for estimating AGS in metagenomic samples. AGS is estimated based directly on preprocessed high-quality metagenomic reads (AGS1) and after three iterative steps to remove potential eukaryotic reads (AGS2) and viral reads detected based on the RefSeq viral genome database (AGS3) or de novo (AGS4). See the “Methods” section for more details. b Relationship between depth and proportion of total putative eukaryotic and viral sequences in marine metagenomic collections. The blue line indicates the fitted one-tailed Spearman correlation (r), with the corresponding 95% confidence intervals for the curve indicated by grey bands. The density distribution of the estimated proportion of contaminants is shown in green, with the corresponding median values (µ) highlighted. Values in parenthesis denote the filter size range of sampled metagenomes. c The fraction of ‘contaminating’ reads is highest in the epipelagic ocean relative to other ocean depth layers. EPI Epipelagic (~3–200 m), MES Mesopelagic (200–1000 m), BAT Bathypelagic (1000–4000 m). Values in parenthesis indicate the number of metagenomes. Only the results from the Malaspina Vertical Profiles (MProfile) metagenomes are shown as they cover greater depths of the global ocean (mean 1114 m; Supplementary Data 1). d Eukaryotic and viral metagenomic sequences significantly increase AGS estimates for prokaryotic plankton in marine metagenomes. Values in parenthesis show number of metagenomes for AGS1 and AGS2. e AGS estimates decreased in most metagenomic samples (85%; n = 220) after decontamination compared to predictions directly from preprocessed metagenomes by 1–19% (n = 39). Boxplots (c–e) show the median as middle horizontal (c, d) or vertical (e) lines and interquartile ranges as boxes (whiskers extend no further than 1.5 times the interquartile ranges). Data are shown as circular symbols, while mean values are shown as white colored diamonds. Values at the top (c, d) indicate the adjusted significant P-values of the unpaired (c) and paired (d) two-sided Wilcoxon test with Benjamini-Hochberg correction. Source data are provided as a Source Data file.

