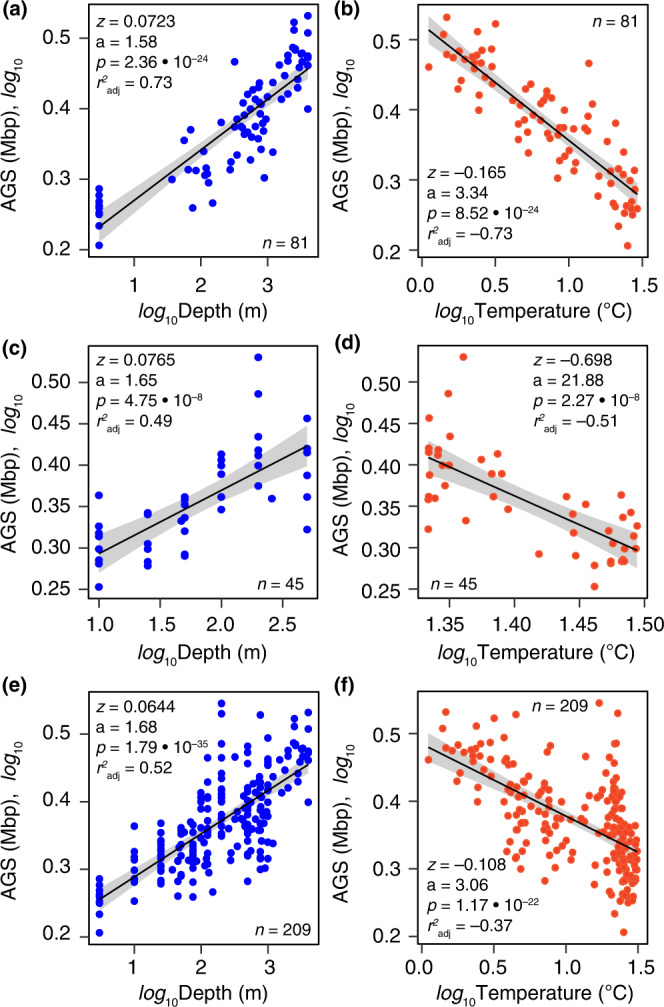
Fig. 3. Scaling rate of genome size of marine prokaryotes with abiotic factors.

A linear fit on a logarithmic scale illustrates the power law rates at which estimated average genome size (AGS) changes with depth (a, c, e) and temperature (b, d, f) for metagenomes at global (Malaspina Profile, a, b) and regional (Red Sea, c, d) scales. Panels e and f show the same scaling relationships in these two datasets, but analyzed together with the temporal dataset from Station ALOHA (n = 83). The solid black line and grey error bands (a–f) indicate the regression curve and 95% confidence intervals for the best power law curve fit, respectively. The power law exponent (z), intercept (a), model significance p-value (p), and the adjusted coefficient (r2 adj) are shown in individual panels based on the F-test. Further details are provided in Supplementary Data 5 and 6. Source data are provided as a Source Data file.
