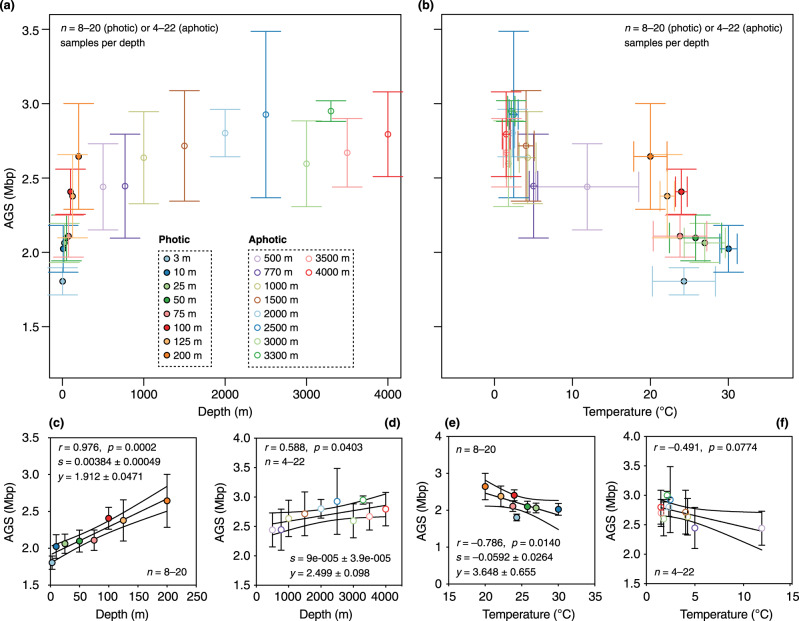
Fig. 4. The rate of change of AGS estimates with depth and temperature is greater in the thermocline.
Two-way plots of mean (circular symbols) of the estimated average genome size (AGS) and depth (a) and between AGS estimates and temperature (b) across horizontal transects at similar ocean depths at the global scale (n = 204 metagenomes). Horizontal and vertical error bars depict standard deviation of the mean depth (x-axis in panel a) or temperature (x-axis in b) and the mean AGS [y-axis in panels (a) and (b)]. Only metagenomes represented by four independent samples at similar depths in different sampling locations were considered (n = 4–22 metagenomes per depth). Circular symbols are color-coded by depth, with closed and open circles denoting samples from the photic (3–200 m, 8 depths; n = 106, 8–20 metagenomes per depth) and aphotic (> 200–4000 m, 10 depths; n = 106, 4–22 metagenomes per depth) layers, respectively. c–f Spearman rank correlations (one-tailed) between mean AGS estimates and depth (c, d) or temperature (e, f) in the photic (c, e; n = 8–20 metagenomes per depth) and aphotic (d, f; n = 4–22 metagenomes per depth) layers. The circular symbols show the mean AGS estimate and the error bars show the standard deviation (SD). The solid black line and grey dashed lines indicate the regression curve and 95% confidence intervals for the curve, respectively. The means (± SD) of regression slope (s) and y-axis intercept (y) are given for curves that were significantly linear (p < 0.05). Source data are provided as a Source Data file.

