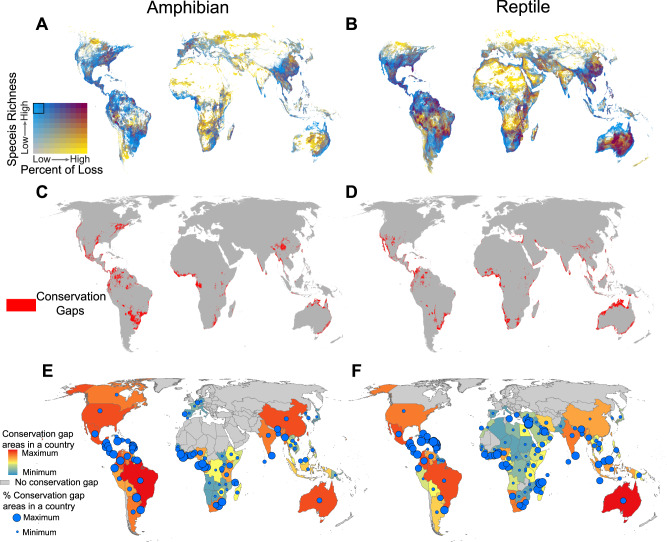
Fig. 3. Conservation priority and conservation gaps for global herpetofauna by 2070 (RCP 4.5).
Bivariate maps showing species richness versus percent of species loss for A amphibians and B reptiles. Each color change means a 10% quantile shift in either variable. Noteworthy, areas in blue represent areas that currently fall into the top species richness category and that are expected to suffer a low percent of species loss due to climate change by 2070; in short, they are climate-robust areas of high species richness. C, D represent conservation gaps (areas falling into the top 20% in terms of species richness and the bottom 20% in terms of future species loss due to climate change, yet fall outside the PA network of amphibians and reptiles which are outlined in black in the legend of (A) and (B). E, F conservation gaps for countries. Colors represent the area of conservation gaps in countries, and circle sizes represent the percentage of conservation gap area with respect to the land area in countries. We assume future land use remains unchanged for this study.

