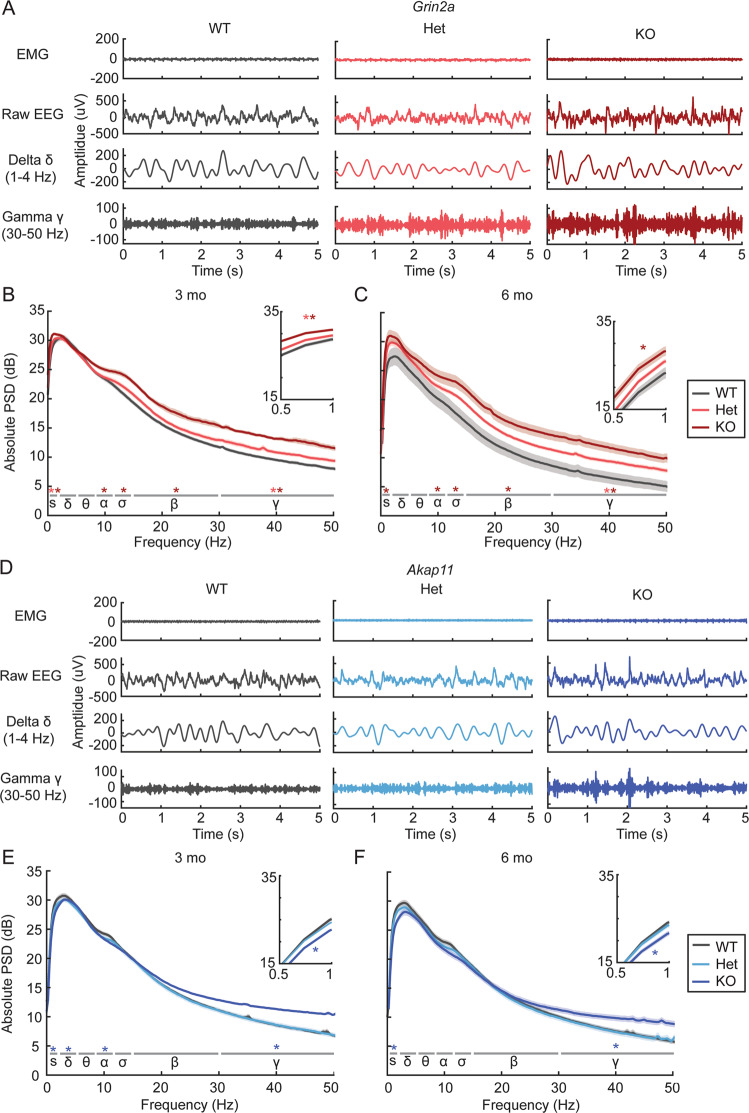
Fig. 3. Power spectral analysis of brain oscillations in Grin2a and Akap11 mutant mice during NREM sleep.
A Representative EMG and EEG (raw, delta- and gamma-filtered) traces from Grin2a WT, Het, and KO animals during NREM sleep. B, C Absolute NREM power spectra for 3- and 6-month Grin2a mutants during the light cycle. Light and dark red/blue asterisks indicate oscillations for which +/− and −/− mice, respectively, differed significantly from WT littermates (p < 0.05) in each of the frequency bands: slow (s), 0.5–1 Hz; delta (δ), 1–4 Hz; theta (θ), 4–8 Hz; alpha (α), 8–12 Hz; sigma (σ), 12–15 Hz; beta (β), 15–30 Hz; gamma (γ), 30–50 Hz. Shading indicates mean ± standard error. Insets show magnified view of the graph in the slow oscillation range (0.5–1 Hz). n = 11–12 mice/group. D Representative EMG and EEG traces from Akap11 WT, Het and KO animals during NREM sleep. E, F Absolute NREM power spectra for 3- and 6-month Akap11 mutants during the light cycle.

