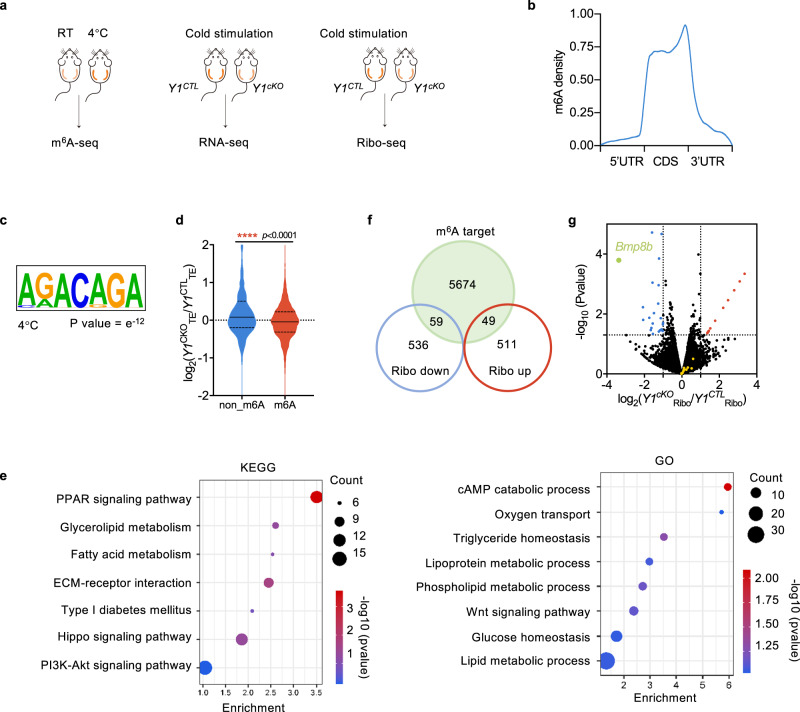
Fig. 4. Transcriptome‐wide identification of YTHDF1‐regulated transcripts in beige adipose tissue.
a Schematic description of the m6A-seq and RNA-seq, and Ribo-seq experiments. b Metagene plot of m6A peak distribution in iWAT at 4 °C. c Consensus motif of m6A sites in beige adipose tissue. d Violin plots showing TE changes between Ythdf1CTL and Ythdf1cKO mice for nonmethylated (non‐m6A) and methylated (m6A) transcripts. ****P < 0.001, Mann–Whitney test. No adjustments. e Top KEGG and GO analysis terms enriched for transcripts during beiging and downregulated translation levels. f Overlap of m6A targeted transcripts with translationally downregulated or upregulated genes. g Volcano plot of fold changes in translation levels from iWAT of cold-treated Y1CTL and Y1cKO mice. The upregulated (red) and downregulated (blue) genes are highlighted. Green dot indicates the Bmp8b gene. The other BMP genes were highlighted in yellow. Mann–Whitney test. Source data are provided as a Source Data file.

