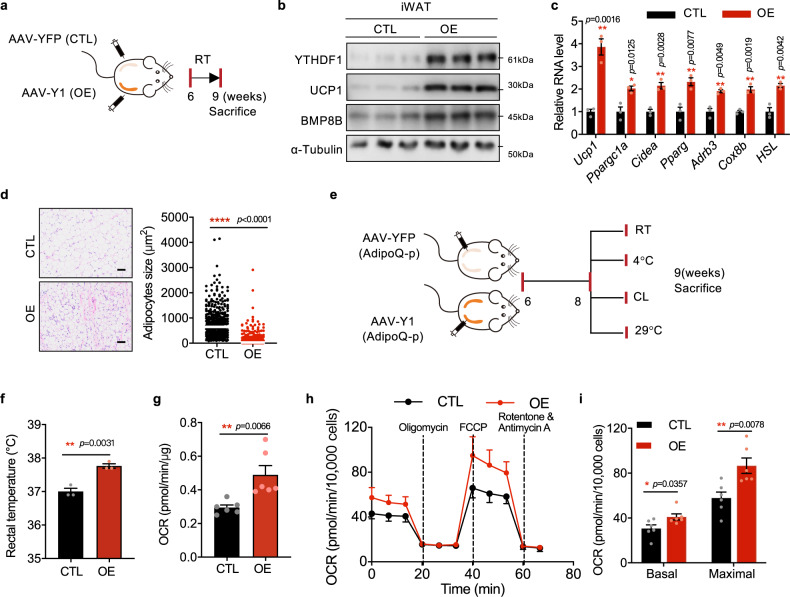
Fig. 6. WAT-specific YTHDF1 overexpression promotes beiging.
a Schematic of the mouse treatment regimen. b Immunoblot analysis of YTHDF1, UCP1 and BMP8B in iWAT. c mRNA levels of thermogenesis-related genes. Data were presented as mean ± SEM (n = 4). ns, not significant, *P < 0. 05. d H&E staining of iWAT. Scale bar, 50 μm. The white line indicated the average size. No adjustments. e Schematic of the mouse treatment regimen. f Rectal temperature of Y1CTL and Y1OE littermates. t-test. g The OCR of iWAT from CTL and OE mice. f, g Data were presented as mean ± SEM (n = 6). **P < 0.01, ***P < 0.001. h The OCR in primary preadipocytes isolated from CTL and OE mice determined by Seahorse. i The average basal and maximal respiration rates in primary preadipocytes. Data in h, i were presented as mean ± SEM (n = 10,000 cells exmined over 3 independent experiments). *P < 0. 05, **P < 0.01. All of the P-values are determined by unpaired two-sided t-test. Source data are provided as a Source Data file.

