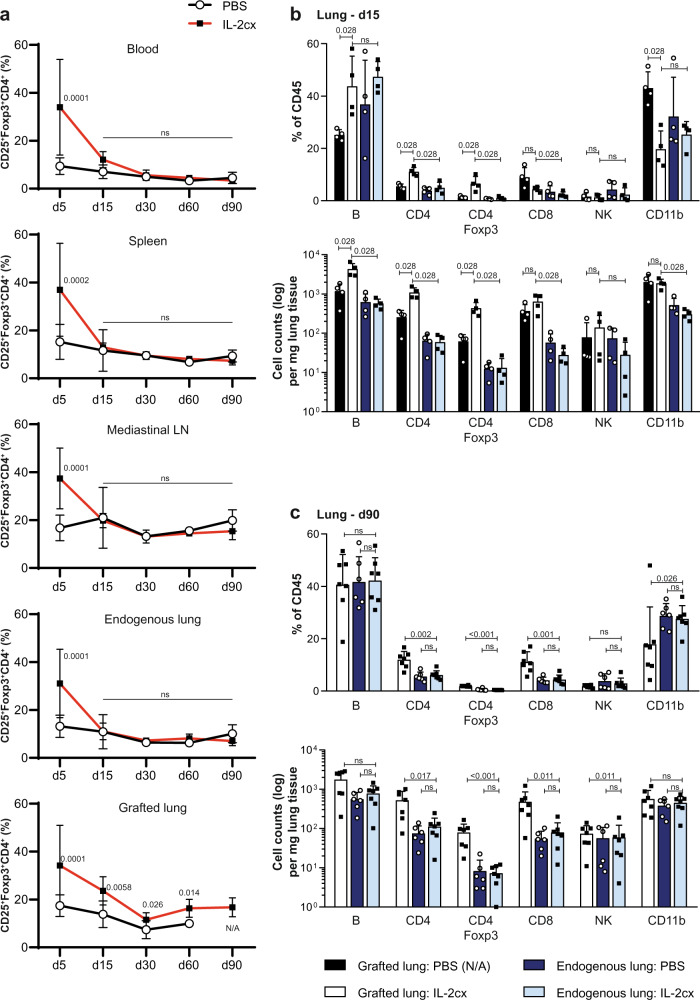
Fig. 4. Dynamics of regulatory T cells and other immune cell subsets in different organs following treatment and lung transplantation.
BALB/c lungs were transplanted as in Fig. 1a into C57BL/6 recipients pre-treated as indicated. a Percentages of CD25+ forkhead box p3 (Foxp3)+ CD4+ T cells in blood, spleen, mediastinal lymph nodes (LN), endogenous lung, and grafted lung of PBS- (open circles) and IL-2cx-treated (filled squares) lung-allografted mice on indicated days after transplantation. Data are shown as mean ± SD of n ≥ 4 mice of 3–7 independent experiments (exact numbers provided in Source Data file). b, c Percentages (top graphs) and total cell counts (bottom graphs) of indicated immune cell subsets in endogenous lungs and grafted lungs of PBS- and IL-2cx-treated mice, as indicated. Tissues were harvested and analyzed on days 15 (b) and 90 (c) after transplantation. No immune cells from grafted lungs of PBS-treated mice could be isolated on day 90 due to advanced fibrosis of grafted lungs (N/A, not available). Data are shown as mean ± SD of n ≥ 4 mice of 2–3 independent experiments. Statistical comparisons were calculated using two-sided Mann–Whitney U test with calculated p values shown. ns not significant.

