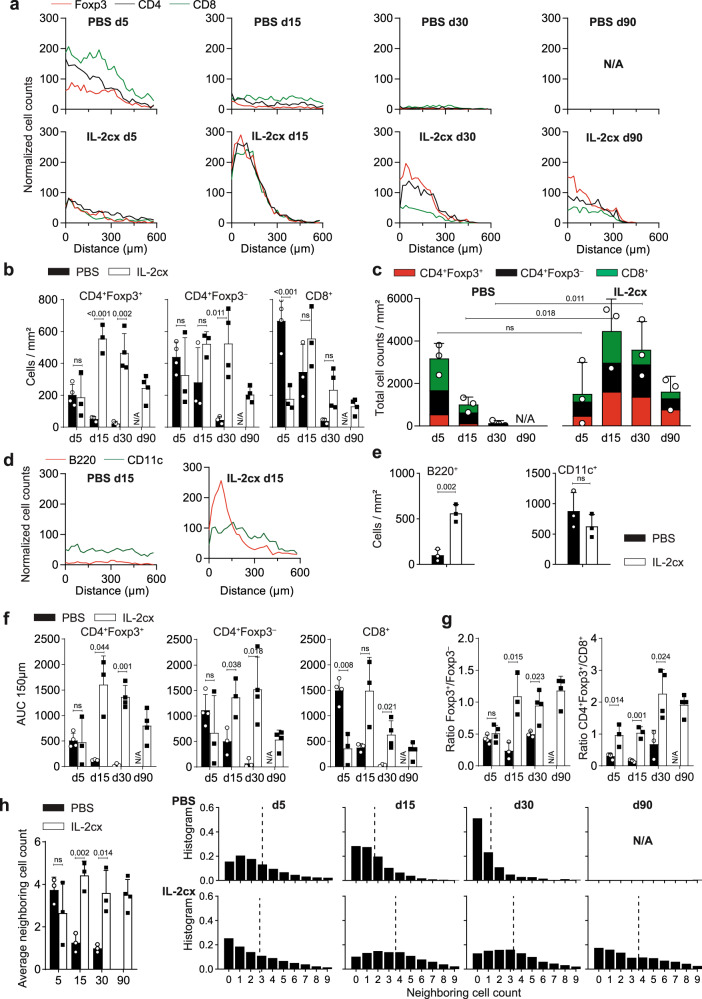
Fig. 6. Spatial distribution of immune cell subsets in allografted lungs.
BALB/c lungs were transplanted as in Fig. 1a into C57BL/6 recipients pre-treated as indicated. a Distance of Foxp3+ T (red lines), Foxp3– conventional CD4+ T (black lines), and CD8+ T cells (green lines) from nearest SMA+ bronchus based on immunofluorescence analysis in grafted lungs of representative PBS- (top panels) and IL-2cx-treated mice (bottom panels). b Quantification of Foxp3+CD4+ Treg (left graph), Foxp3– conventional CD4+ T (middle graph), and CD8+ T cells (right graph) based on immunofluorescence analysis of whole lungs. c Quantification of Foxp3+CD4+ Treg, Foxp3– conventional CD4+, and CD8+ T cells in whole lungs, represented as stacked bar graphs. d Distance of B220+ B (red lines) and CD11c+ myeloid cells (green lines) from nearest SMA+ bronchus based on immunofluorescence analysis in grafted lungs of PBS- and IL-2cx-treated mice on day 15 after transplantation. e Quantification of B220+ B (left graph) and CD11c+ myeloid cells (right graph) based on immunofluorescence analysis. f Quantification of the areas under the curve (AUC) of normalized cell counts of Foxp3+CD4+ Treg, Foxp3– conventional CD4+, and CD8+ T cells within 150 μm from the nearest SMA+ bronchus. g Ratios of CD4+Foxp3+ Treg over CD4+Foxp3– T cells and of CD4+Foxp3+ Treg over CD8+ T cells in total lungs. h Quantification of cells neighboring T cells, shown in overview (left graph) and as representative examples in indicated conditions and at indicated timepoints. Data are presented as mean ± SD of n ≥ 3 mice of 2–3 independent experiments. Significance of difference in (b, e–h) was calculated using two-sided Student’s t test with calculated p values shown.

