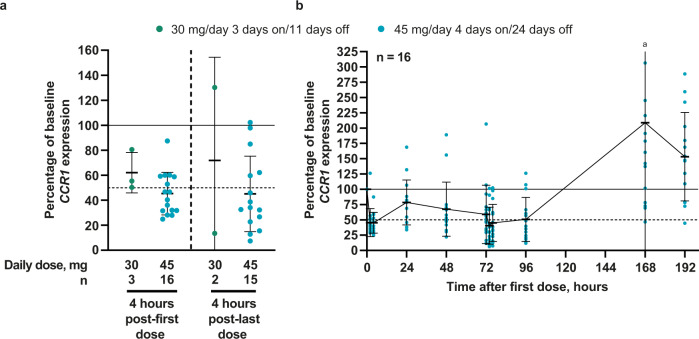
Fig. 6. Blood CCR1 mRNA levels in part B.
a Four hours after the first (left) and last dose (right) in part B, and b from 0–192 h in patients receiving trotabresib 45 mg/day 4 days on/24 days off. For both figures, colored data points indicate individual patient values for the percentage of baseline CCR1 expression and black lines and error bars indicate mean ± SD. Source data are provided as a source data file. aData not shown for one patient with a percentage of baseline CCR1 expression of 1110.93; SD for this time point was 260.36. CCR1 C-C motif chemokine receptor 1, mRNA messenger RNA.

