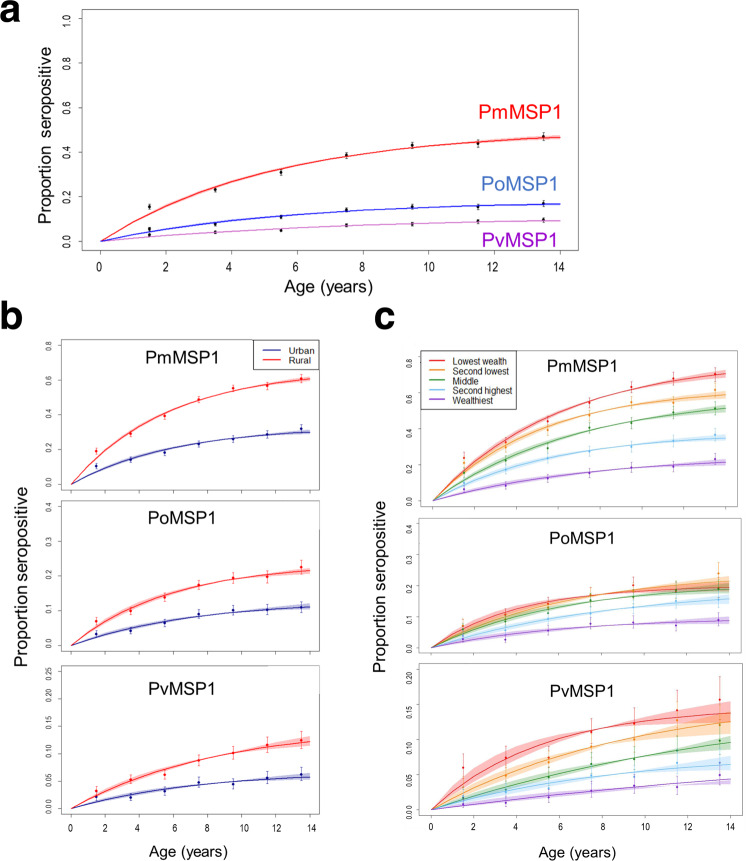
Fig. 5. Seropositivity by age for IgG against PmMSP1, PoMSP1, and PvMSP1 antigens among children under 15 years: Nigeria, 2018.
All participants (a), and as separated by urban or rural residence (b), or wealth quintile (c). Dots represent the proportion seropositive and error bars represent the 95% confidence intervals for seropositivity for each age group. Curves represent the fit of a catalytic seroconversion model, and shaded areas represent the 95% credible intervals of the model predictions. For all plots, n = 31,234 biologically independent samples.

