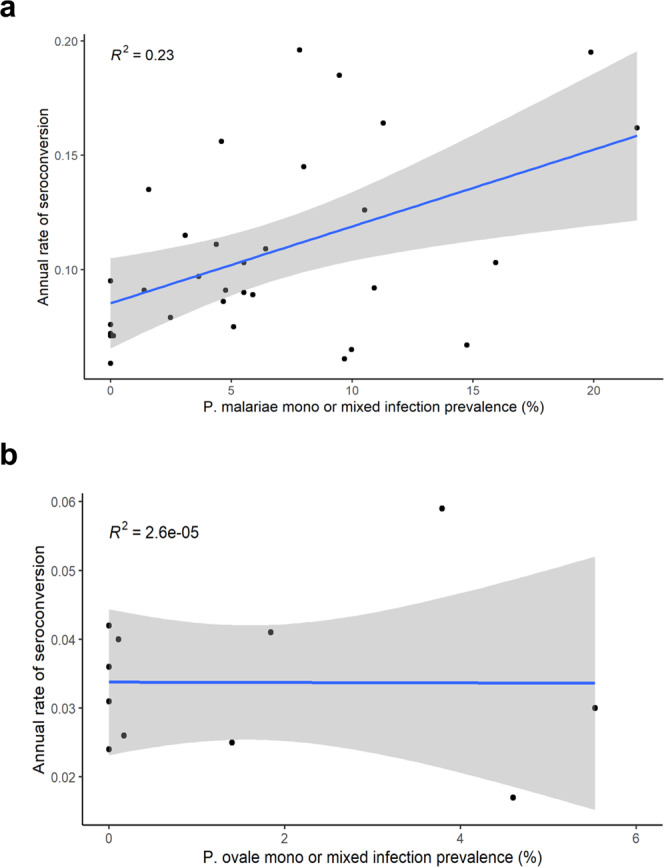
Fig. 6. Correlation of active infection and serological data for both P. malariae and P. ovale: Nigeria, 2018.

Association between infection prevalence of P. malariae (a) and P. ovale (b) infections per state and estimated annual seroconversion rate (SCR) by state to PmMSP1 and PoMSP1, respectively. Each point represents one state, blue line is the linear regression line of best fit, shading indicates the standard error, and inset text the R2 estimate. For PmMSP1, the serocatalytic model converged for 86.5% (32/37) of states to provide a seroconversion rate, and for PoMSP1, the model converged for 29.7% (11/37) of states.
