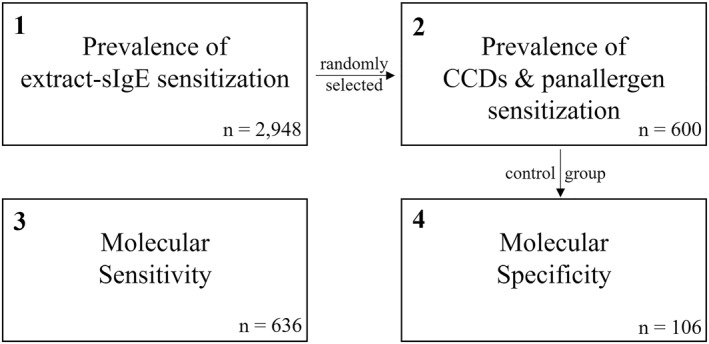
FIGURE 1.

Flow‐chart of the four analyses performed. In total, clinical data and test results of 3.590 patients were investigated. Patients of analysis 2 were randomly selected from analysis 1 (6 × 100 patients with 0–5 pollen sensitizations). The control group from analysis 2 (100 patients without pollen allergy) and six additional patients were used for analysis 4.
