FIGURE 1:
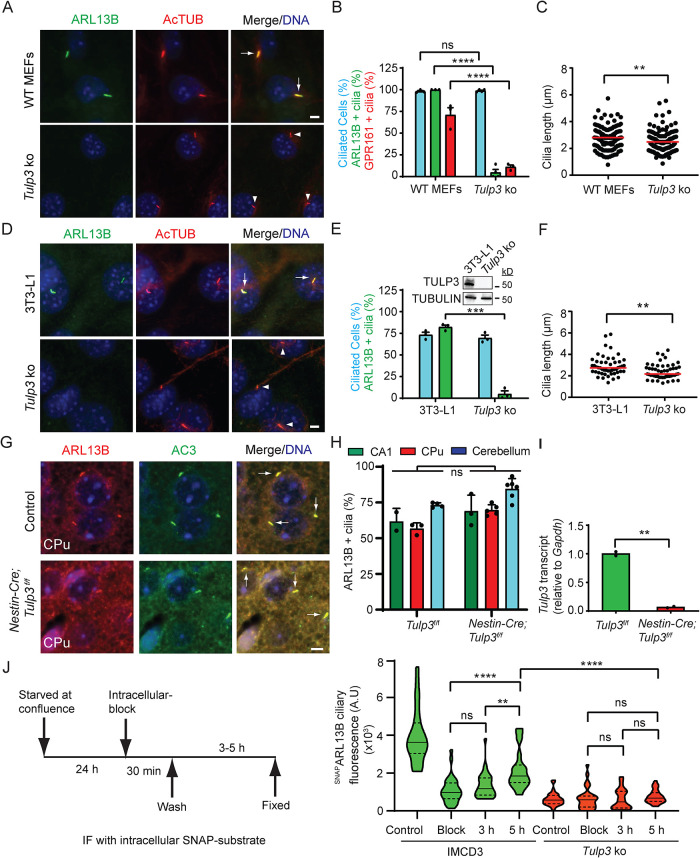
TULP3 determines ciliary trafficking of ARL13B. (A) MEFs were serum starved upon confluence for 24 h before fixation. Fixed cells were immunostained for ARL13B (green) or GPR161 (shown in Supplemental Figure S1A), and acetylated tubulin (AcTUB, red) and counterstained for DNA (blue). (B) Cilia were counted from three to four fields/experiment from two experiments, n > 200/condition. Data represent mean ± SD. (C) Cilia length was measured from MEFs by immunostaining for acetylated tubulin. n > 100/condition. (D) 3T3-L1 preadipocyte cells were grown to confluency and cultured further for 72 h to promote ciliation before fixing. The fixed cells were immunostained for ARL13B (green) and acetylated tubulin (red) and counterstained for DNA. (E) Cilia from D were counted from three experiments, and total counted cells are >200 for each condition. Data represent mean ± SD. Inset, immunoblot of cell lysates. (F) Cilia length was measured from WT or Tulp3 ko 3T3L1 cells by immunostaining for acetylated tubulin. n > 50/condition. (G) Brain sections at P7 were immunostained for ARL13B (red) and AC3 (green) and counterstained for DNA (blue). CPu, Caudate-putamen. (H) Cilia were counted from control or conditional knockout (cko) at P7. n > 400 for CPu, 50–250 for the CA1 region in hippocampus, and >650 for cerebellum from multiple fields from one control and two cko mice. Data represent mean ± SD. (I) Transcript levels from control or Nestin Cre; Tulp3f/f mice. Data represent technical replicates from one mouse each. (J) IMCD3 cells stably expressing GFP-SNAPARL13B were starved as indicated in the schematic after reaching confluence. After blocking using BG-Block, cells were washed and later fixed at the indicated times. “Block,” immediately fixed after blocking. Control, untreated with BG-Block. Newly trafficked SNAP-tagged proteins in cilia were tracked by immunofluorescence using TMR-Star and acetylated tubulin. Images in Supplemental Figure S3C. Violin plots of ciliary intensities of TMR-Star from n > 30 cells/condition. Representative of two experiments. Scale, 5 μm; ****, p < 0.0001; ***, p < 0.001; **, p < 0.01; ns, not significant. Adjusted p values shown in J. Arrows and arrowheads indicate cilia positive and negative for the indicated proteins, respectively. See also Supplemental Figures S1 and S2.

