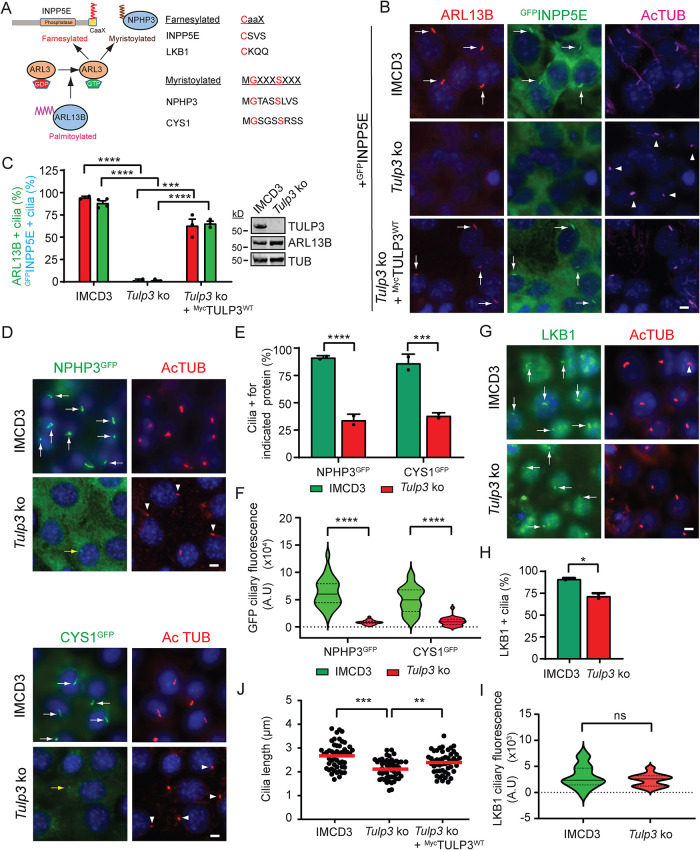
FIGURE 2:
TULP3 determines ciliary trafficking of ARL13B-dependent cargoes. (A) Cartoon depicting the role of ARL13B in regulating the release of farnesylated and myristoylated cargoes in the ciliary compartment via ARL3. The red aa signify critical residues in the stated motifs. (B) IMCD3 parental and Tulp3 ko cells (Supplemental Figure S2) stably expressing GFPINPP5E ± MycTULP3 were grown until confluence and serum starved for 36 h before fixation. Cells were immunostained for ARL13B, GFP (INPP5E), and acetylated tubulin (AcTUB) and counterstained for DNA. (C) Cilia from B were counted in two to four fields/experiment from two experiments. n > 200 cilia/condition. Western blot of cell lysates. (D) IMCD3 cells stably expressing NPHP3GFP or CYS1GFP were grown until confluence and serum starved for 36 h before fixation. Cells were immunostained for GFP and acetylated tubulin (AcTUB) and counterstained for DNA. (E) GFP-positive cilia from D were counted from two experiments, n > 200 cilia/condition. (F) Ciliary fluorescence intensities were measured from NPHP3LAP- or CYS1LAP-expressing IMCD3 cells that showed cilia positive for these fusion proteins and are represented as a violin plot. n > 30 cilia/condition. (G) IMCD3 cells were grown until confluence and serum starved for 36 h before fixation. Cells were immunostained for LKB1 and acetylated tubulin (AcTUB) and counterstained for DNA. (H) Cilia from G from two experiments were counted. n > 200 cilia/condition. (I) Ciliary fluorescence intensities were measured from IMCD3 cells and are shown as a violin plot. n > 30 cilia/condition. (J) Cilia lengths were measured from cells (B) by acetylated tubulin immunostaining (50 cilia/condition). Scale, 5 μm. ****, p < 0.0001; ***, p < 0.001; **, p < 0.01; *, p < 0.05; ns, not significant. Data represent mean ± SD. Arrows and arrowheads indicate cilia positive and negative for the indicated proteins, respectively. Yellow arrows, cilia with low fluorescence. See also Supplemental Figure S3.

