. 2022 Nov 2;29(6):1056–1067. doi: 10.1158/1078-0432.CCR-22-2115

Figure 2.

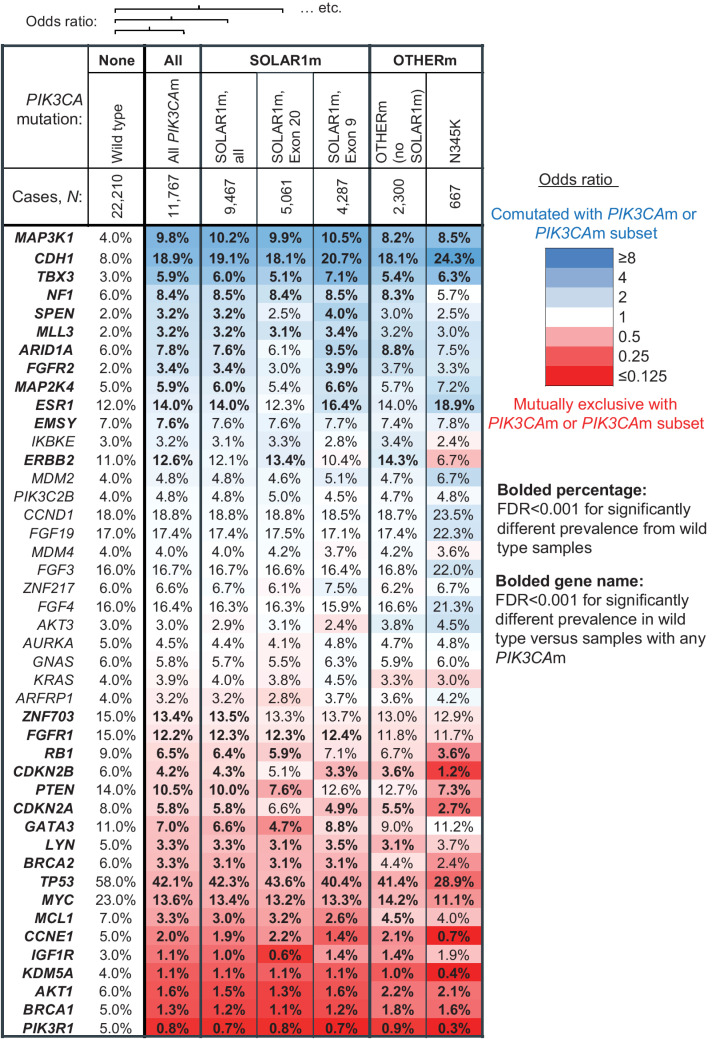
Figure 2. The mutational landscapes of breast cancer tissue biopsies with SOLAR1m and OTHERm are similar. Co-occurrence and mutual exclusivity of other gene alterations with PIK3CA mutations in 33,977 tissue biopsies from patients with breast cancer. Mutations, rearrangements, and copy-number alterations were considered. Genes with ≥3% prevalence of genomic alteration in the wild-type and/or PIK3CA-mutated (PIK3CAm) cohort are arranged in order of OR. Heatmap colors correspond to degree of coalteration (blue) or mutual exclusivity (red) with PIK3CA mutations, as quantified by the log2 OR of being detected in the same sample as a PIK3CA mutation, or a particular type of PIK3CA mutation. The cohorts compared with PIK3CA wild-type samples are: all PIK3CAm, all SOLAR1m, the SOLAR1m exon 20 subset, the SOLAR1m exon 9 subset, the OTHERm cohort, and the N345K subset of the OTHERm cohort. Prevalence of mutations in each cohort indicated in each cell, and bolded where FDR < 0.001. P values were multiple test corrected across all genes assayed (including those not displayed) using the Benjamini–Hochberg method.

The mutational landscapes of breast cancer tissue biopsies with SOLAR1m and OTHERm are similar. Co-occurrence and mutual exclusivity of other gene alterations with PIK3CA mutations in 33,977 tissue biopsies from patients with breast cancer. Mutations, rearrangements, and copy-number alterations were considered. Genes with ≥3% prevalence of genomic alteration in the wild-type and/or PIK3CA-mutated (PIK3CAm) cohort are arranged in order of OR. Heatmap colors correspond to degree of coalteration (blue) or mutual exclusivity (red) with PIK3CA mutations, as quantified by the log2 OR of being detected in the same sample as a PIK3CA mutation, or a particular type of PIK3CA mutation. The cohorts compared with PIK3CA wild-type samples are: all PIK3CAm, all SOLAR1m, the SOLAR1m exon 20 subset, the SOLAR1m exon 9 subset, the OTHERm cohort, and the N345K subset of the OTHERm cohort. Prevalence of mutations in each cohort indicated in each cell, and bolded where FDR < 0.001. P values were multiple test corrected across all genes assayed (including those not displayed) using the Benjamini–Hochberg method.