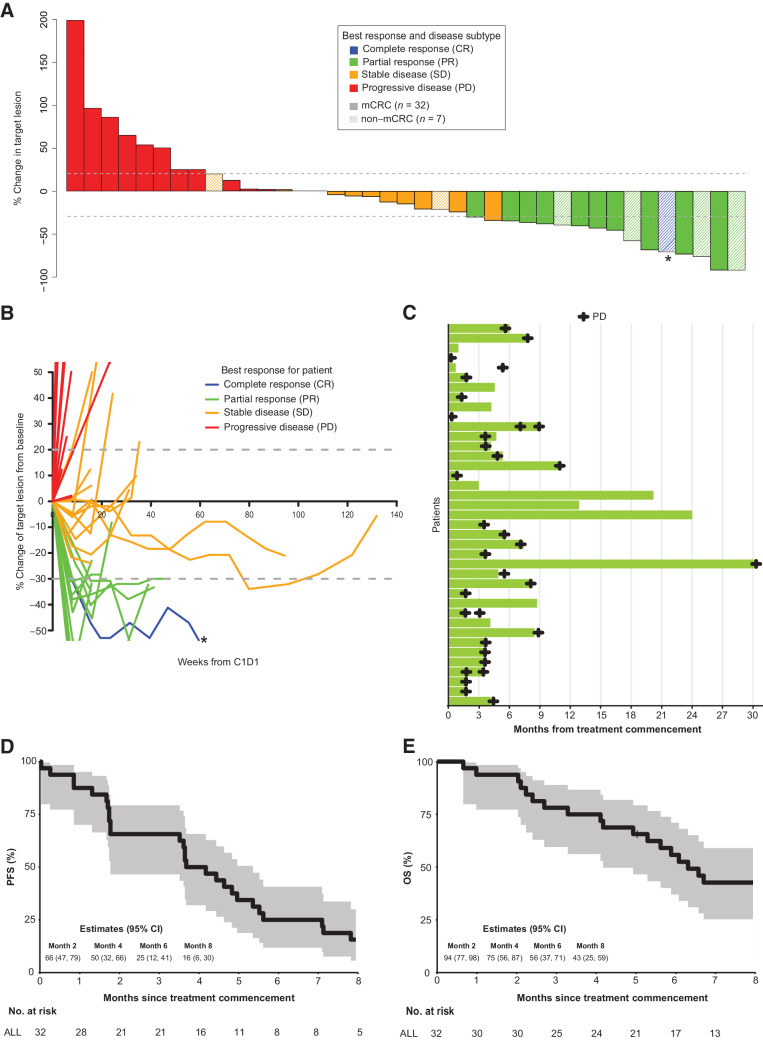
Figure 2.
Efficacy of vemurafenib and erlotinib in patients with BRAF V600E positive mCRC and other cancers. A, Waterfall plot with best percentage tumor change from baseline target lesions and best confirmed overall response for evaluable patients (n = 39). *, CR based on a reduction in measurements in a lymph node to below the level of being considered measurable. CR, complete response. B, Spider plot demonstrating response to treatment for each patient over time (n = 39). *, CR based on a reduction in measurements in a lymph node to below the level of being considered measurable. C, Swimmer plot showing objective response of time on treatment for 39 evaluable patients. Individual patients represented as lines. D, Kaplan–Meier estimate of PFS for patients with mCRC (n = 32). The shaded areas represent 95% CI. E, Kaplan–Meier estimate of OS for patients with mCRC (n = 32). The shaded areas represent 95% CI.

