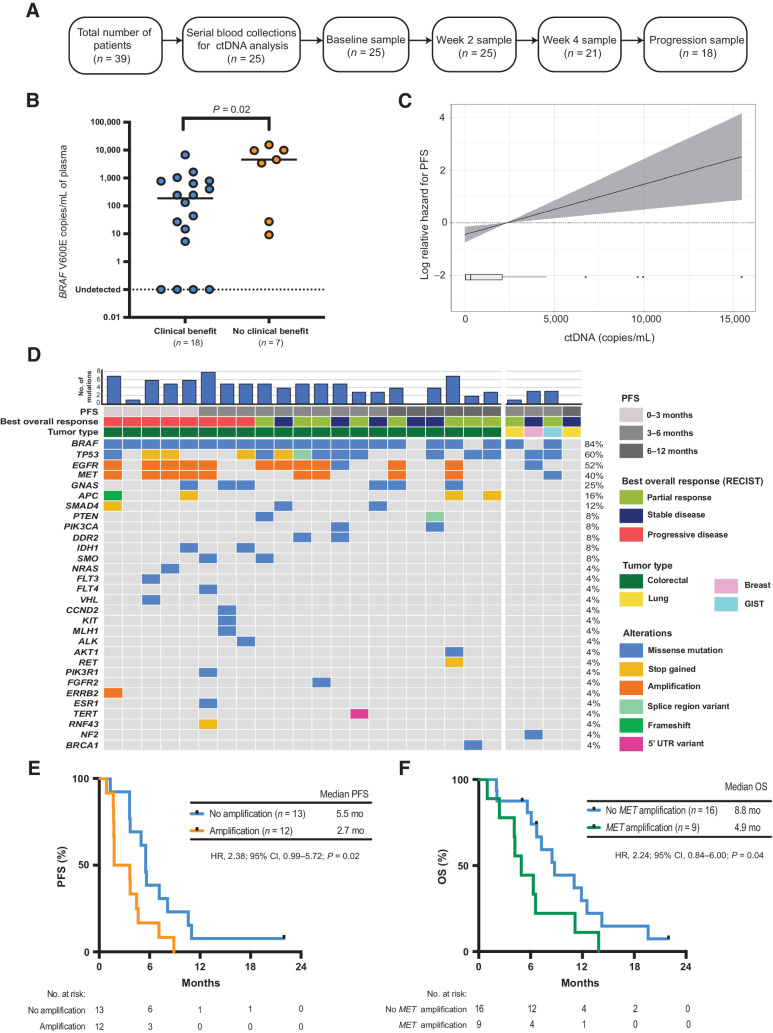
Figure 3.
Baseline ctDNA analysis. A, Consort diagram of plasma samples analyzed from EViCT trial. B, Baseline ctDNA levels (copies/mL) according to clinical benefit rate. C, Linear Cox regression model showing the association between ctDNA copies/mL (as assessed by ddPCR) and PFS (95% CI represented by shading). D, Landscape of somatic mutations detected through targeted sequencing of baseline plasma DNA in 25 patients enrolled on the EViCT trial. Each column represents an individual patient, and each row indicates a specific alteration. The color of bars is indicative of the type of mutation with gray = wild-type. The bar diagram on the top shows the total number of detectable mutations per patient. E, Kaplan–Meier estimate of PFS for patients (n = 25) with a detectable amplification(s) versus no amplification in baseline plasma. Amplification is defined as the presence of any amplification in EGFR, MET, and/or ERRB2. F, Kaplan–Meier estimate of OS for patients (n = 25) with a detectable MET amplification versus no MET amplification in baseline plasma.

