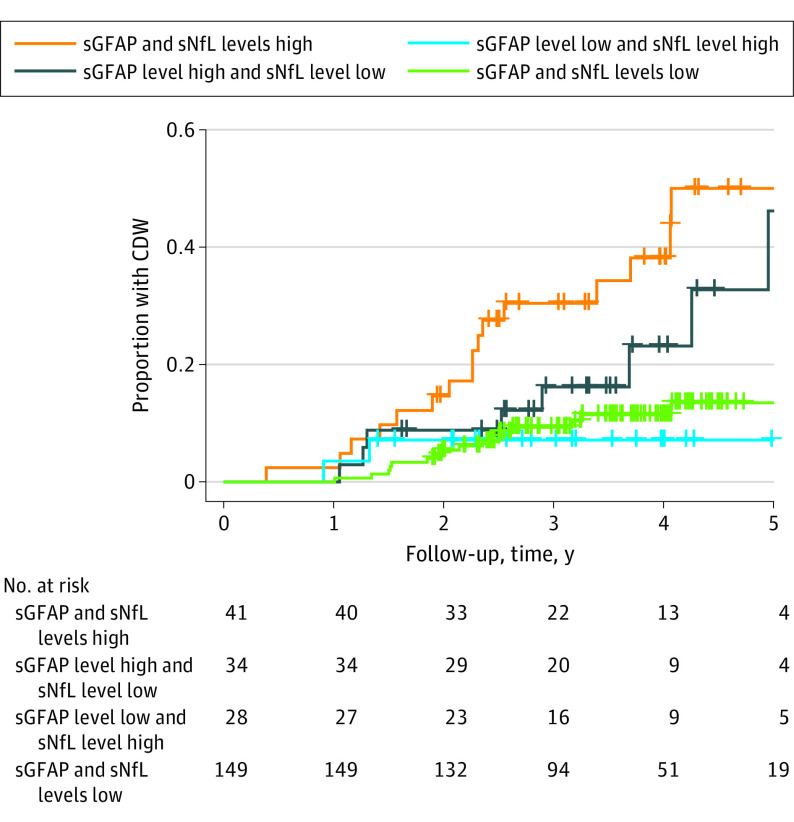
Figure 3. Kaplan-Meier Curves Using Combined Biomarker Data to Predict Time to Confirmed Disease Worsening (CDW).
Optimized cutoffs of serum glial fibrillary acidic protein (sGFAP) and serum neurofilament light chain (sNfL) z scores from receiver operating characteristic curve analysis, based on the Youden index, were used to dichotomize patient groups. High sGFAP/high sNfL levels were associated with a 4-fold (hazard ratio [HR], 4.09; 95% CI, 2.04-8.18; P < .001) increased risk of CDW compared with low sGFAP/low sNfL levels. The combination of high sGFAP/low sNfL levels showed a slightly reduced risk (HR, 2.32; 95% CI, 0.99-5.42; P = .05). The combination of low sGFAP/high sNfL levels, however, did not show an increased risk on CDW (HR, 1.03; 95% CI, 0.30-3.53; P = .97).

