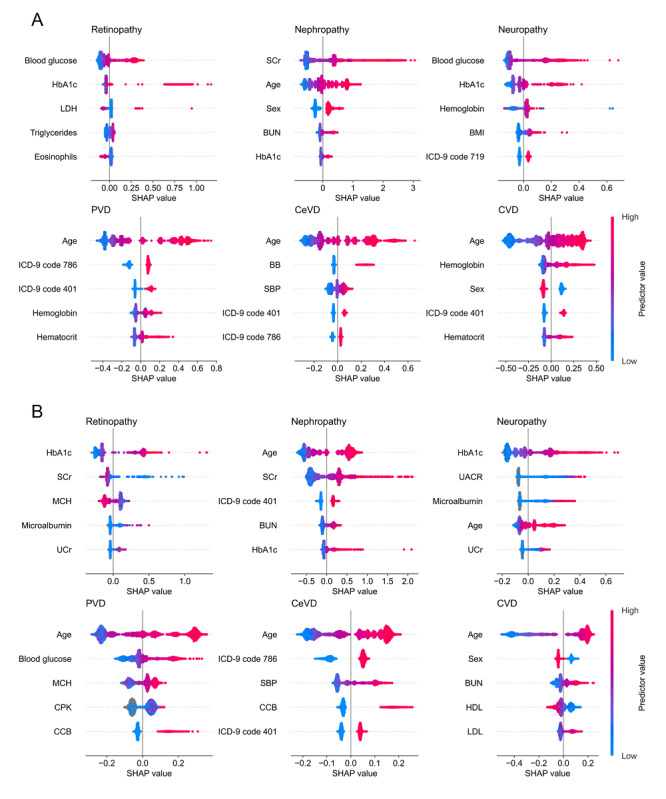
Figure 3.

(A) SHAP plots for individuals with prediabetes. (B) SHAP plots for individuals with diabetes. For the SHAP plots, the ranking of the predictors is based on their importance listed in descending order. Each dot represents 1 individual, and its position on the x axis denotes its SHAP value. Elements with a positive (negative) SHAP value pull the prediction toward an increased (decreased) risk of developing a complication. The color of each dot is a representation of the corresponding predictor value, where red indicates a high, blue a low, and gray a missing value. BB: beta blocker; BUN: blood urea nitrogen; CCB: calcium channel blocker; CeVD: cerebrovascular disease; CPK: creatine phosphokinase; CVD: cardiovascular disease; HbA1c: glycated hemoglobin; HDL: high-density lipoprotein; ICD-9 719: other and unspecified disorders of joint; ICD-9 786: symptoms involving respiratory system and other chest symptoms; ICD-9 401: essential hypertension; LDH: lactate dehydrogenase; LDL: low-density lipoprotein; MCH: mean corpuscular hemoglobin; PVD: peripheral vascular disease; SBP: systolic blood pressure; SCr: serum creatinine; SHAP: Shapley additive explanations; UACR: albumin to creatinine ratio in urine; UCr: creatinine in urine.
