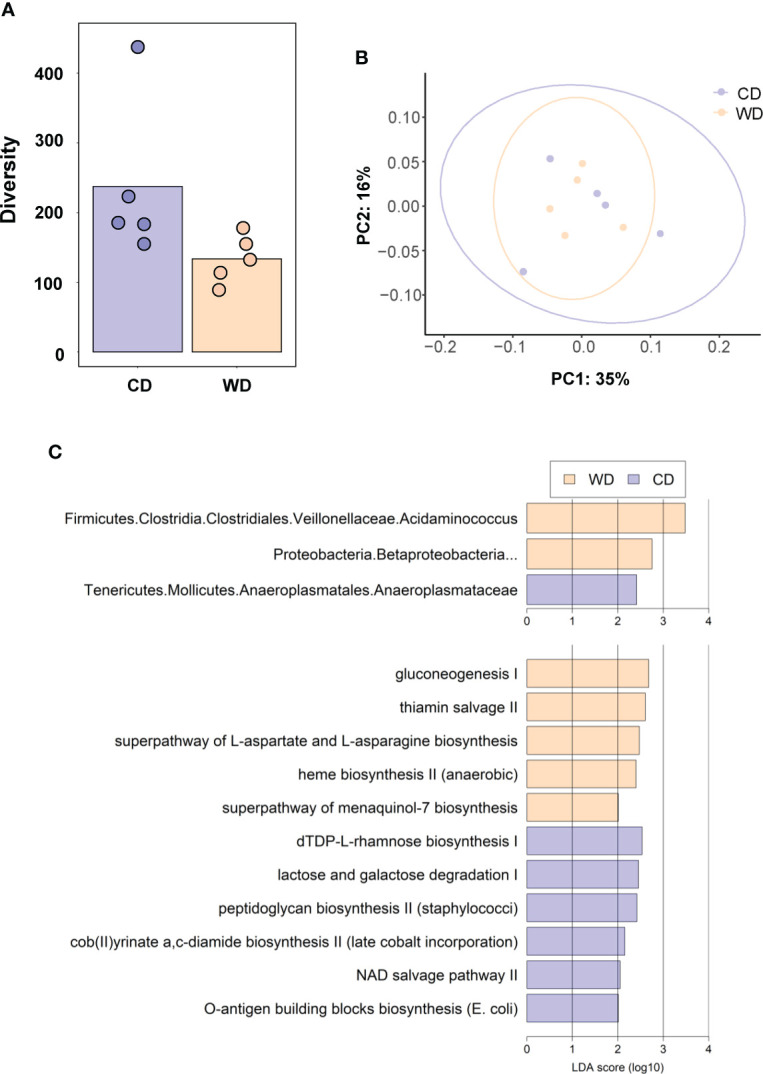
Figure 4.

(A) Alpha diversity measured using Faith’s phylogenetic diversity. Significance of species richness was tested using the Kruskal-Wallis test (P = 0.02). (B) PCoA ordination displaying weighted Unifrac beta diversity. Percent variation explained is shown on each axis (PC1: 35% & PC2: 16%). PERMANOVA significance for the weighted Unifrac distances (P = 0.26). (C) Lefse histograms plotted for significant enrichment in taxa abundances (upper plot) and biochemical pathways (lower plot). n = 5/group.
