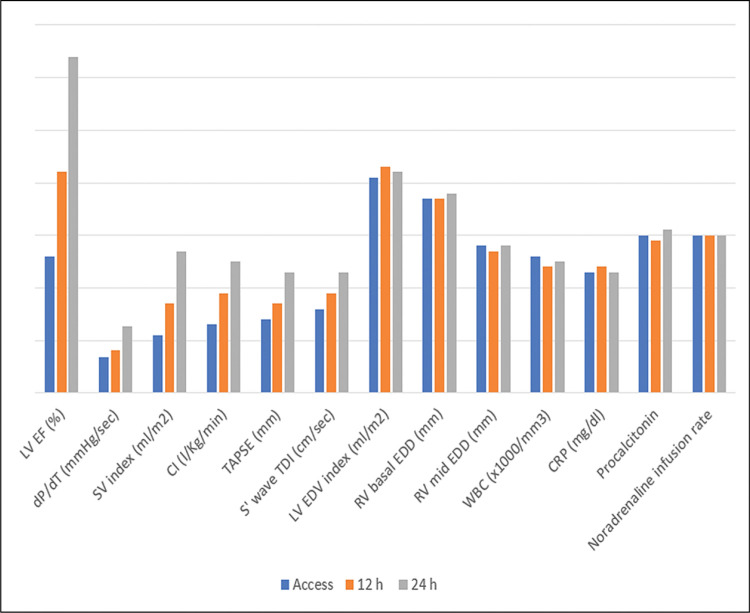
Fig. 3.
This graph depicts the improvement in left ventricular systolic performance indices over time. Of note, concomitant with this improvement was no substantial change in afterload, as expressed by LV and RV size, afterload in relation to Norepinephrine rate infusion, and indices of inflammation.

