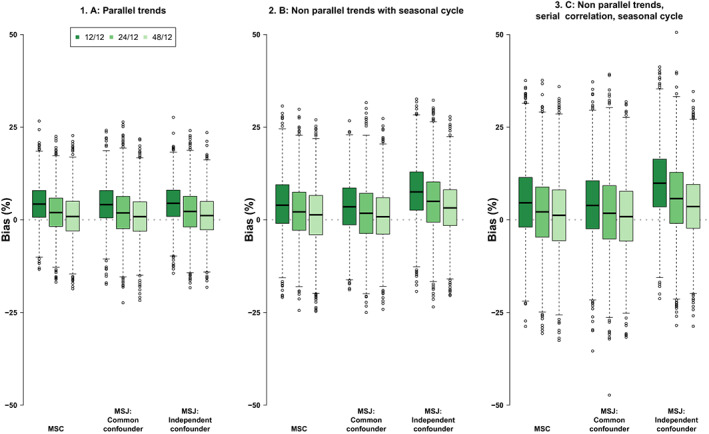
FIGURE 2.

Monte Carlo simulation results for MSC and for MSJ when unobserved confounders for each outcome are either perfectly correlated (MSJ Common confounder) or uncorrelated (MSJ independent confounder). Each plot shows boxplots of bias (%) under scenarios, A, B, and C for 12 (darkest green), 24 (middle green), and 48 (lightest green) pre‐intervention periods and 12 post‐intervention periods across 3000 simulations with 50 treated units and 500 untreated units. MSC, Micro Synthetic Control applied to each outcome separately; MSJ, Micro Synthetic Control applied to both outcomes jointly. [Color figure can be viewed at wileyonlinelibrary.com]
