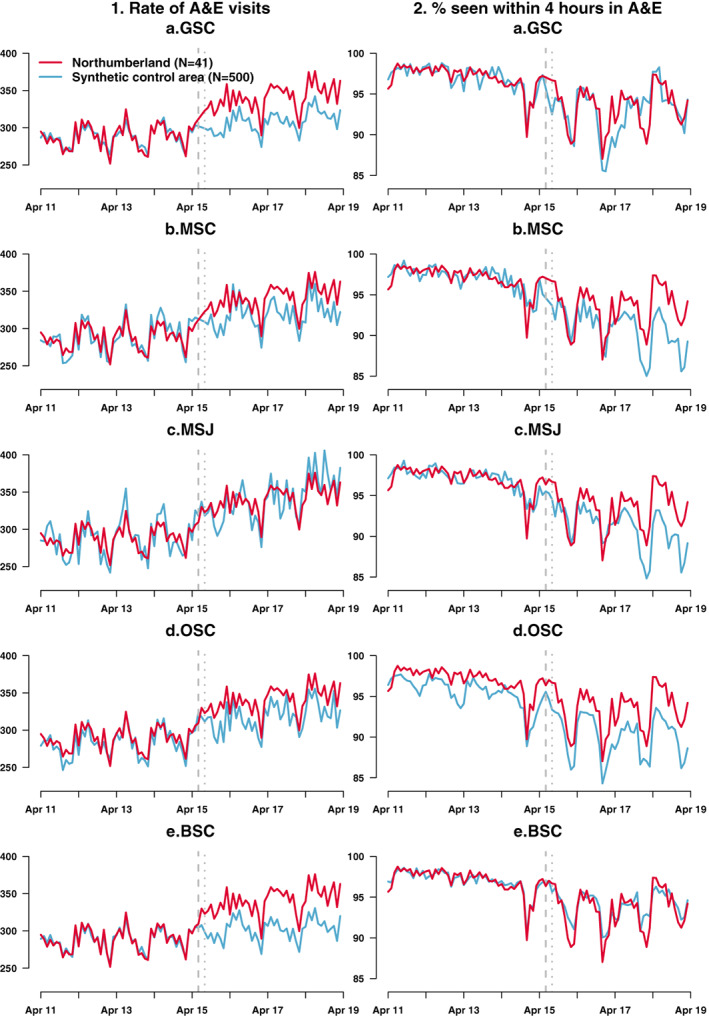
FIGURE 4.

The effect of the opening of the NSEC on (column 1) the rate of A&E visits per 10,000 registered patients per month; (column 2) the percentage seen within 4 h of an A&E visit for each of the synthetic control methods (A) GSC, (B) MSC, (C) MSJ, (D), OSC and (E) BSC. Each plot shows the actual aggregated outcome (red lines) and estimated counterfactuals (blue lines). The vertical dashed lines indicate the bedding‐in‐period between the last pre‐intervention period and the first post‐intervention period. BSC, Bayesian Synthetic Control; GSC, Generalized Synthetic Control; MSJ, Micro Synthetic Control applied to both outcomes jointly; MSC, Micro Synthetic Control applied to each outcome separately; OSC, original synthetic control [Color figure can be viewed at wileyonlinelibrary.com]
