Figure 3.
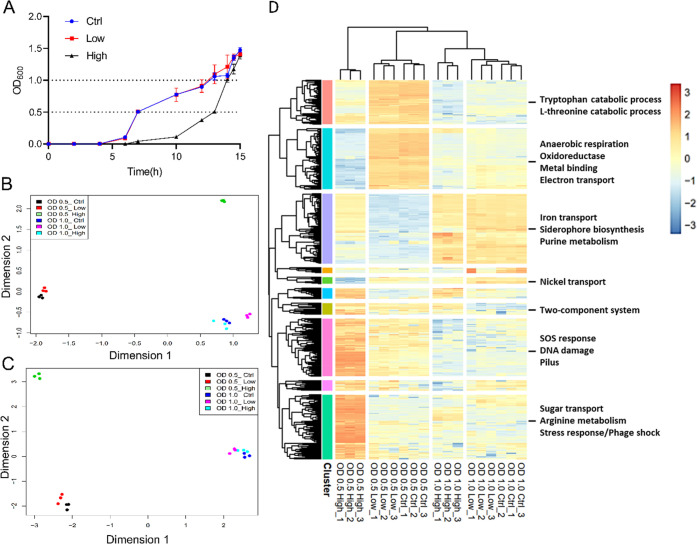
Global transcriptome and metabolome effects on E. coli following treatment with LP-600. (A) Growth curves of E. coli BW25113 treated with DMSO (control) and with low (0.0625 μg/mL; low) or high (128 μg/mL; high) concentrations of LP-600, followed by OD600 measurement over time. (B,C) Multidimensional scaling (MDS) analysis of E. coli transcriptomes obtained by RNA sequencing (B) and of metabolomes recorded by UPLC-ESI-QToF in C18 column with positive ionization mode (C) from the treatment of E. coli cultures with DMSO (Ctrl), or LP-600 at low or high concentrations. Cultures were harvested in the midexponential phase at OD600 = 0.5, or in the stationary phase at OD600 = 1.0. Log-counts-per-million (CPM) values from RNA-seq and log2-transformed values from metabolomics among samples were applied in MDS analysis to project Euclidean distances between samples to x- and y-axis. (D) Heat map following a hierarchical clustering of the 500 genes that had the highest variance in expression. Heatmap displays their log-CPM values with hierarchical clustering of genes and samples. Relative gene expression is color-coded from red (high expression) to blue (low expression). Ten major clusters were indicated by colored bars on the left. The heat map with dendrograms was generated by the R package limma and pheatmap. The functional enrichment analysis for each cluster of genes was conducted via STRING and DAVID WebService (version 4.0.3). The most significantly enriched terms are listed (see also the Supporting Information data set, sheet 2).

