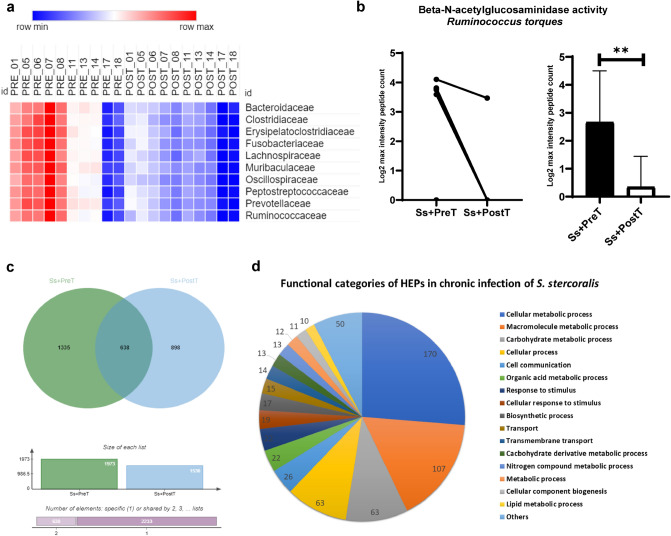
Figure 6.
Metaproteomic analysis result. (a) Heatmap of abundance of fecal proteins derived from the top 10 bacterial families for ten individuals both before (Ss+PreT (T1)) and after ivermectin treatment (Ss+PostT (T2)). (b) Relative levels of the beta-N-acetylglucosaminidase enzyme of Ruminococcus torques expressed in Ss+PreT and Ss+PostT groups by log2 max intensity peptide count. Data are presented as line graphs pre- and post-treatment of individual samples (7/10 samples contained this protein) and as a bar chart. Each column shows data from a single individual. (c) Jvenn diagram showing numbers of highly expressed proteins (HEPs) in Ss+PreT and Ss+PostT groups and (d) functional categories of HEPs in Ss+PreT in a pie chart.

