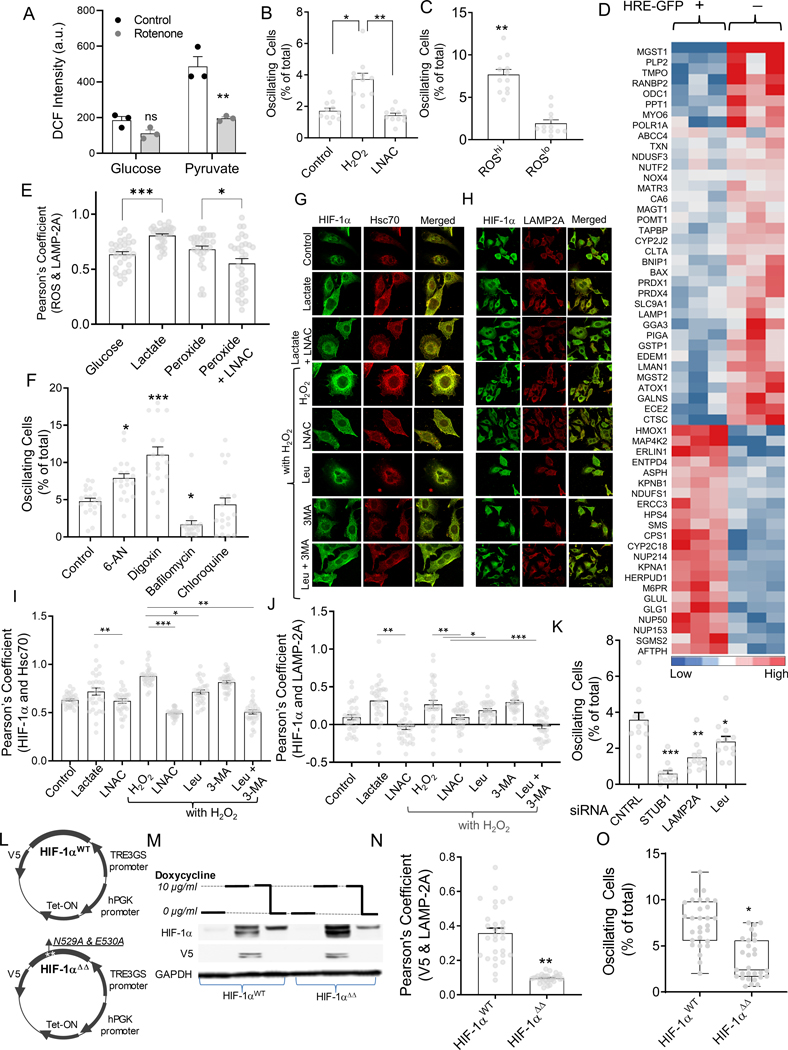
Fig 2. ROS-induced CMA controls HIF-1α dynamics in hypoxic cells.
(A-D) ROS increases oscillations in HIF-1α activity; (A) Average DCF-DA intensities in HeLa cells cultured with 25 mM glucose or pyruvate, before and after treatment with Rotenone for 30 minutes; n = 3 exp; (B) Fraction of HRE-GFP cells displaying oscillation in the presence of 5 μM H2O2 with or without 1 mM LNAC; n = 10 exp; (C) Fraction of oscillatory cells in subpopulations sorted for high CellROX and low CellROX, imaged after 6 hours subsequent to sorting; n =12 exp. (D) Microarray analysis of gene transcripts related to redox, and chaperone-mediated autophagy (CMA) pathways in HypoxCR-HEK293 cells 17 cultured in hypoxia for 12 hours, and sorted for GFPhi and GFPlo levels. (E-J) ROS induced CMA mediates HIF-1α oscillations; (E) Pearson’s coefficient of correlation between ROS levels and LAMP-2A levels in individual HeLa cells shown on the right; n > 28 cells; (F) Percentage of oscillating cells in the presence of activators (50 mM 6-AN, and 200 nM Digoxin), and inhibitors of lysosomal degradation (10nM Bafilomycin, and 50 μM Chloroquin). (G-H) Representative images showing HIF-1α, along with lysosomal Hsc70 13D3 (G), and LAMP-2A (H) in HeLa cells cultured for 12 hours in 1% O2, 10 mM lactate, lactate with LNAC, as well as 25 μm H2O2 without or with LNAC, or CMA inhibitor Leupeptin (50 μM); (I-J) Pearson’s coefficient for colocalization of lysosomal Hsc70, or LAMP-2A and HIF-1α; n = 30 cells; (K) Live cell imaging analysis of GFP oscillations in HIF-1α-GFP transfected HeLa cells cultured in hypoxia (control), or with Leupeptin (50 μM), or after siRNA mediated knockdown of STUB1 and LAMP-2A; n = 12 cells; (L) Schematic showing plasmid maps for HIF-1αWT and HIF-1αΔΔ with mutation in the KFERQ-like motif in the HIF-1α encoding sequence. (M) Immunoblot showing abundance of V5 tagged-HIF-1α, and total HIF-1α in HIF-1αWT and HIF-1αΔΔ cells maintained in 5% O2 and treated with doxycline for 8 hours and then withdrawn for 2 hours; GAPDH shown as loading control; (N) Pearson’s coefficient of correlation between HIF-1α and LAMP-2A in HeLa cells stably expressing HIF-1αWT and HIF-1αΔΔ; n > 25 cells; (O) Live cell imaging analysis of GFP oscillations in HeLa cells transduced with wild-type HIF-1αWT and mutated HIF-1αΔΔ; n > 20 samples. Error bars: s.e.m.; *: p < 0.05, **: p < 0.01, ***: p < 0.001.

