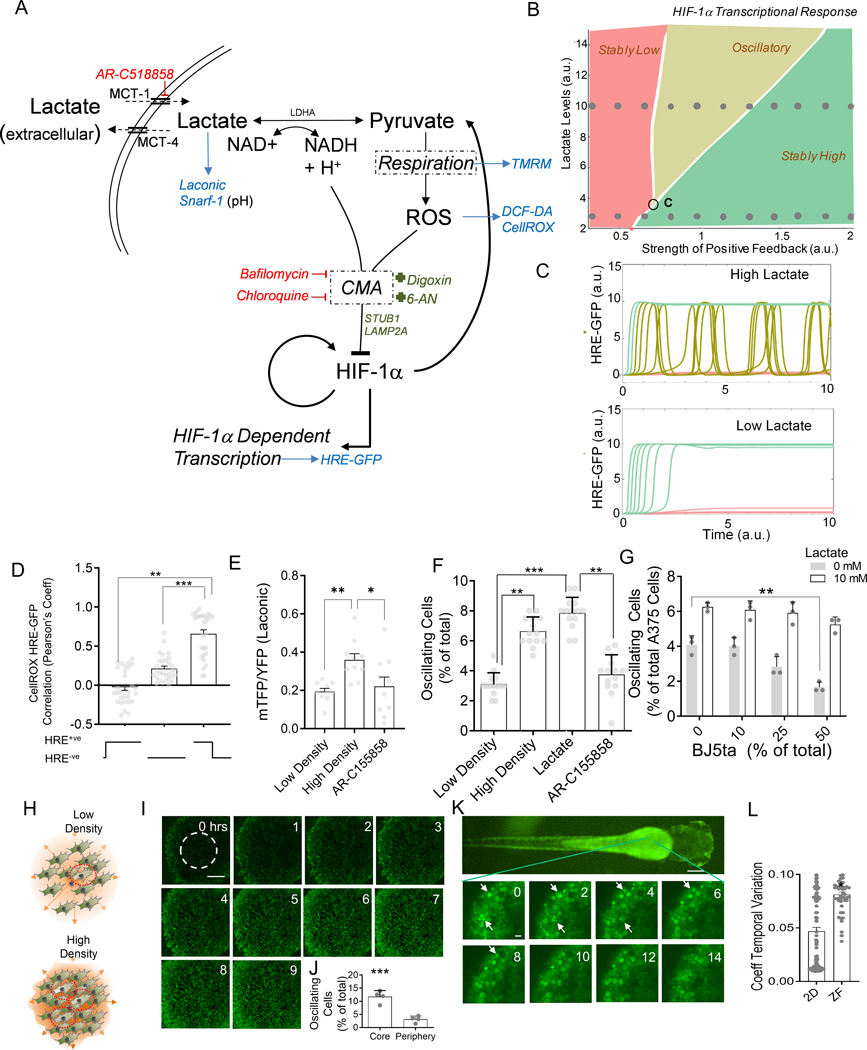
Fig 4. Modeling CMA mediated HIF-1α degradation accounts for diverse dynamics in HIF-1α activity mediated by cell density.
(A) Hypothesized molecular circuit controlling the dynamics of HIF-1α responses; CMA: chaperone mediated autophagy; Also listed are the main perturbations used in the study: Red: inhibitors, Green: activators, Blue: reporters. (B) Bifurcation diagram of the mathematical model corresponding to (A), see Methods, demonstrating existence of different dynamic response modes; ‘C’ denotes the critical point of the phase diagram corresponding to the onset of oscillatory responses; (C) Model predictions for dynamic HRE-GFP intensity profiles in hypoxic cells in the presence of low and high levels of lactate; Traces correspond to the sets of parameter values indicated by two rows of circular dots in the bifurcation diagram in (B). (D) Pearson’s coefficient showing correlation of HRE-GFP and CellROX levels; n = 30 cells; (E-G) The effect of cell density on variation in HRE-GFP expression; (E) Laconic FRET ratio in A375 cells; n = 12 cells; (F) HRE-GFP transitions in HEK293 cells cultured at low density, at high density with and without 10 mM lactate, or MCT-1 transporter inhibitor; n > 12 exp; (G) Percentage of HRE-GFP oscillations in A375 in co- culture with BJ5ta fibroblasts at different relative percentages, also with lactate; n = 3 exp; (H) Schematic showing that high density in solid tumors can result in lactate buildup in the core, causing increased oscillations in HIF-1α activity; (I-J) Confocal time lapsed images of HRE-GFP HEK293 spheroids in CoCl2 and frequency of GFP switches in the core (area shown within dotted line); Scale bar = 100 μm; n = 4 spheroids. (K) Confocal images showing dynamics of HRE-GFP HEK293 cells in a zebrafish embryo, imaged 1 day after microinjection into the yolk sac; white arrows show cells with changes in GFP expression; (L) Coefficient of temporal variation (standard deviation normalized by mean) over 14 hours of observation for detectable cells in 2D cultures, and zebrafish; n > 40 locations. Error bars: s.e.m.; *: p < 0.05, **: p < 0.01, ***: p < 0.001.

