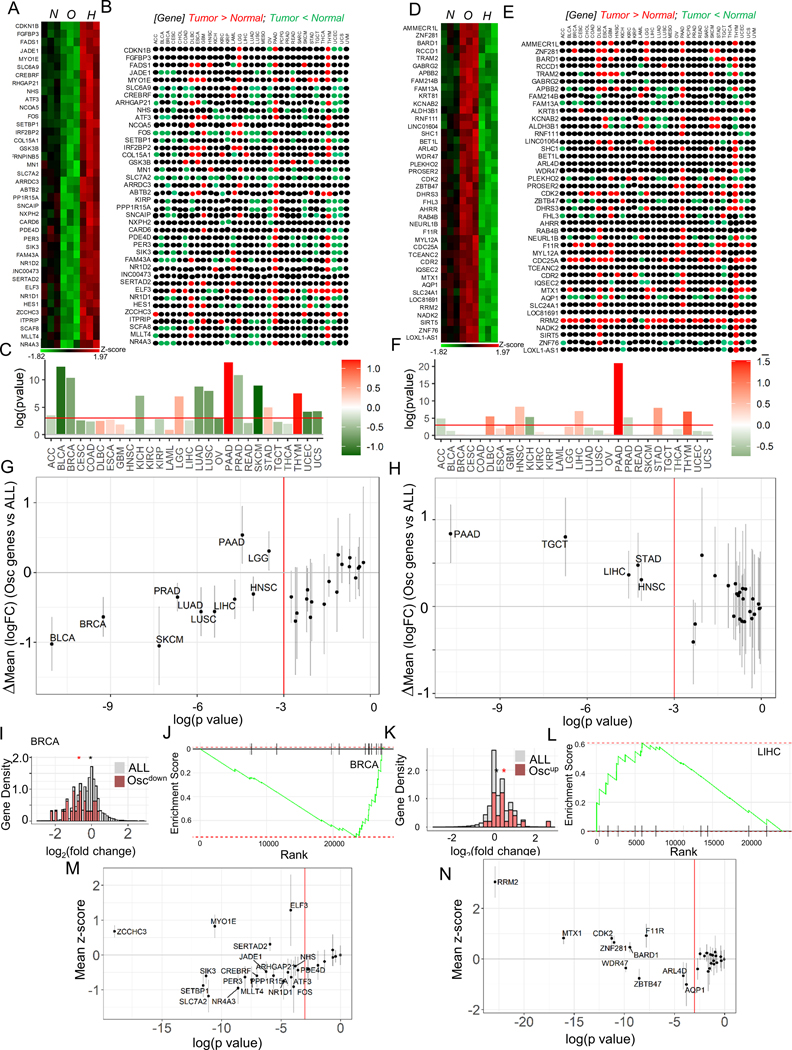
Fig 6. Oscillating hypoxic response dynamics regulates gene expression congruent to many human cancers.
(A-C) Genes downregulated by oscillating hypoxia show a correlatively downregulated signature in many human cancer types. (A) Heatmap showing genes upregulated by hypoxia, but downregulated by oscillatory hypoxia (Oscdown genes), and (B) their relative expression in cancers vs normal tissue in the TCGA tumor database; colors refer to a TCGA study where the given gene is expressed significantly higher (red), or significantly lower (green) in tumor compared to normal tissue sample, with significance for the whole set of Oscdown genes in (C). (D-F) Genes upregulated by oscillating hypoxia also show a correlatively upregulated signature in many human cancer types: (D) Heatmap showing genes downregulated in hypoxia, but upregulated in oscillatory hypoxia (Oscup genes), and (E) direction of their expression in TCGA tumors vs normal samples; color code same as B. (F) Significance of the whole set of Oscup genes shown in tumor vs normal; In C, and F, bars show overall fold change of the geneset, colorbar represents the mean log2fold change between cancer and normal samples. (G-H) Genes differentially regulated by oscillatory hypoxia are significantly downregulated (G), or upregulated (H) when compared against the directional expression of all other genes in those TCGA tumors vs control samples; In both G, and H, each dot represents a tumor comparison with normal tissue; x-axis refer to log(pvalue) of tumor vs normal comparison; bars show 95% confidence interval for mean vs all genes difference; vertical red line marks threshold of pvalue = 0.05. (I-L) Representative examples of Oscdown and Oscup gene sets in breast cancer BRCA, and liver hepatocellular carcinoma LIHC: (I) Histogram showing density of Oscdown genes (green), or all genes (pink); Genes are normalized by total gene numbers; BRCA tumor samples = 1085, normal breast samples = 291. (J) GSEA enrichment analysis in Oscdown gene expression in BRCA vs normal samples; all genes are ranked in order of decreasing tumor/normal fold changes on x-axis, with bars representing Oscdown genes. (K) Histogram showing relative distribution of fold change of Oscdown genes (green), or all genes (pink); Genes are normalized by total gene numbers; LIHC tumor samples = 369, normal breast samples = 160. In I, and K, asterisk represents the mean log2fold change between cancer and normal samples for the corresponding gene set (all or Oscdown /Oscup). (L) GSEA enrichment analysis in Oscup gene expression in LIHC cancers. (M) Oscdown genes are significantly downregulated in many TCGA cancer types when compared to all the other genes; bars show a 95% confidence interval for the difference. (N) Many Oscup genes are significantly upregulated in many TCGA cancer types compared to all the other genes; bars show a 95% confidence interval.

