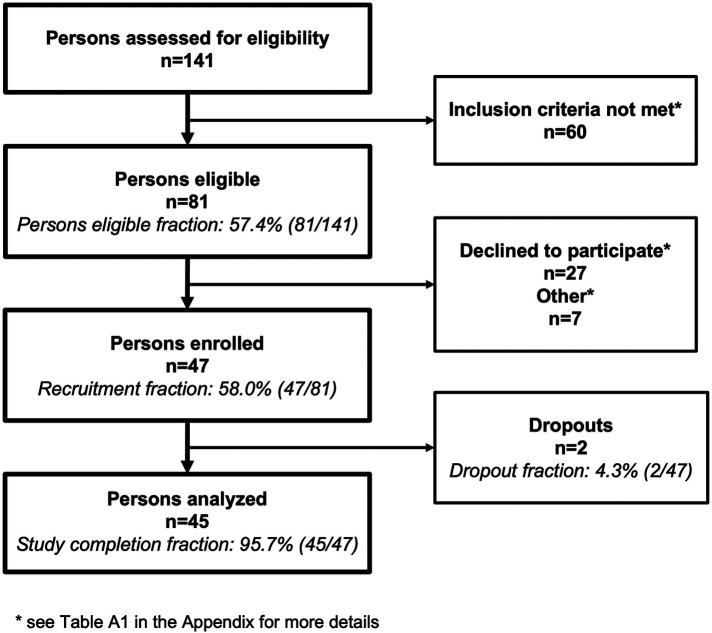
Figure 2.
Flow chart of the study population. In total, 141 persons were assessed for eligibility, 47 were enrolled, and the data of 45 persons were analyzed. Unmet inclusion criteria and the reasons for declining study participation are presented in Supplementary Table AS3.

