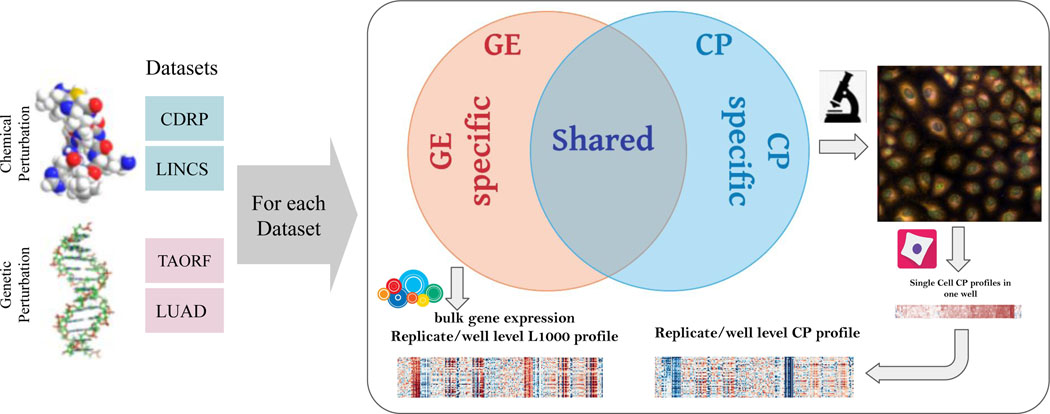
Figure 1. Multi-modal datasets overview.
Multi-modal genetic and chemical perturbation datasets are valuable for many applications. For each dataset, Cell Painting (CP) and Gene Expression (GE) L1000 assays were used to collect morphological and gene expression representations (profiles), respectively. The datasets are described in Supplementary 1. Credits: Chemical structure by GJ Owns, distributed under a CC0 3.0 license. DNA structure by Richard Wheeler, distributed under a CC-BY-SA 3.0.

