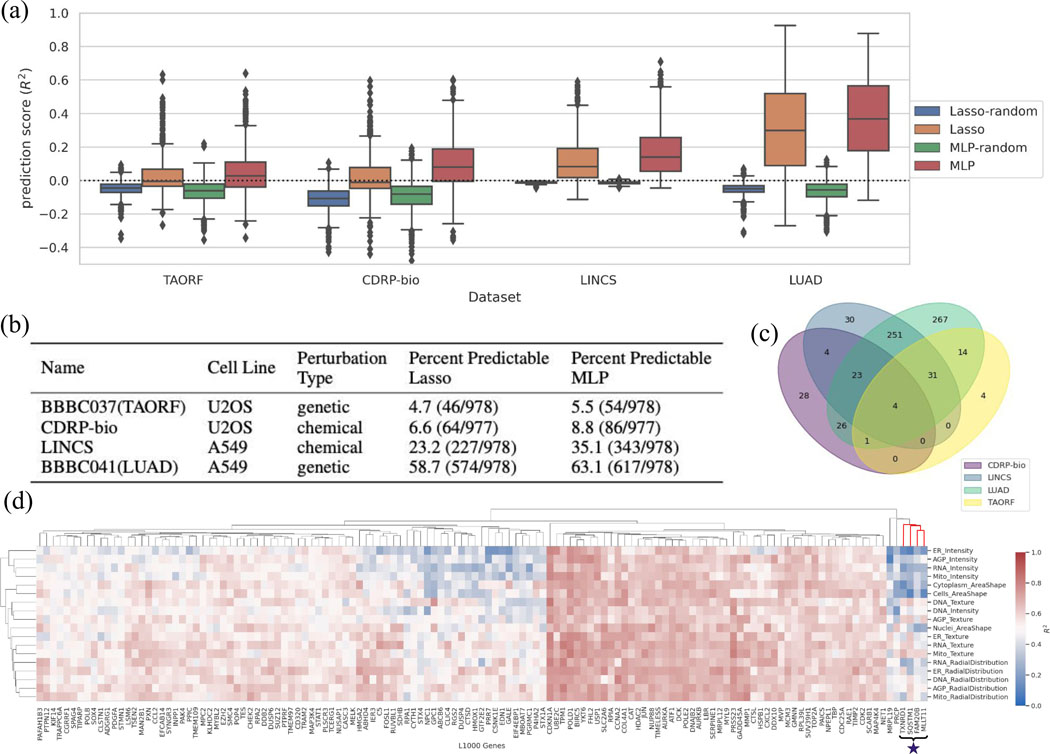
Figure 2. An application using the shared subspace: cross-modality predictions from CP to GE.
(a) Distribution of prediction scores for all landmark genes for each Lasso and MLP model, grouped for each dataset. Many genes are well-predicted, especially using MLP. The random shuffle distributions – where the outputs are shuffled in each iteration– serve as negative controls. Negative values indicate that the prediction is worse than simply computing the mean of the output, and therefore all <0 can be considered equally bad (the model does not generalize at all). The y-axis is trimmed at −0.5 for clarity. Distributions are presented as boxplots, with center line being median, box limits being upper and lower quartiles and whiskers being 1.5× interquartile range; n=978 landmark genes (977 for CDRP-bio dataset). (b) The proportion of genes that are well-predicted (); see Online Methods) are reported as Percent Predictable for each dataset. (c) The overlap of genes predictable by the MLP model ()) are shown across the four datasets; 59 are well-predicted in at least three of the all four datasets. (d) Example of interpretable maps showing the connection between the expression of each landmark gene and the activation of each category of morphological features in the LUAD dataset using the MLP model: each point on the heatmap shows the predictive power of a group of morphological features (on the y-axis) for predicting expression level of a landmark gene (on the x-axis). “Predictive power” here means the scores generated by limiting the prediction to all the features in the y axis group. The cluster marked with a star is discussed in the main text and explored in Extended Data Fig. 4. The heatmap is limited to 131 genes with scores according to any of the morphological groups (on the y-axis). The complete version is provided in the GitHub repository as an xlsx file (https://github.com/carpenterlab/2021_Haghighi_submitted/blob/main/results/SingleGenePred_cpCategoryMap/cat_scores_maps.xlsx) that can be loaded into Morpheus 21 or Python for further exploration.

