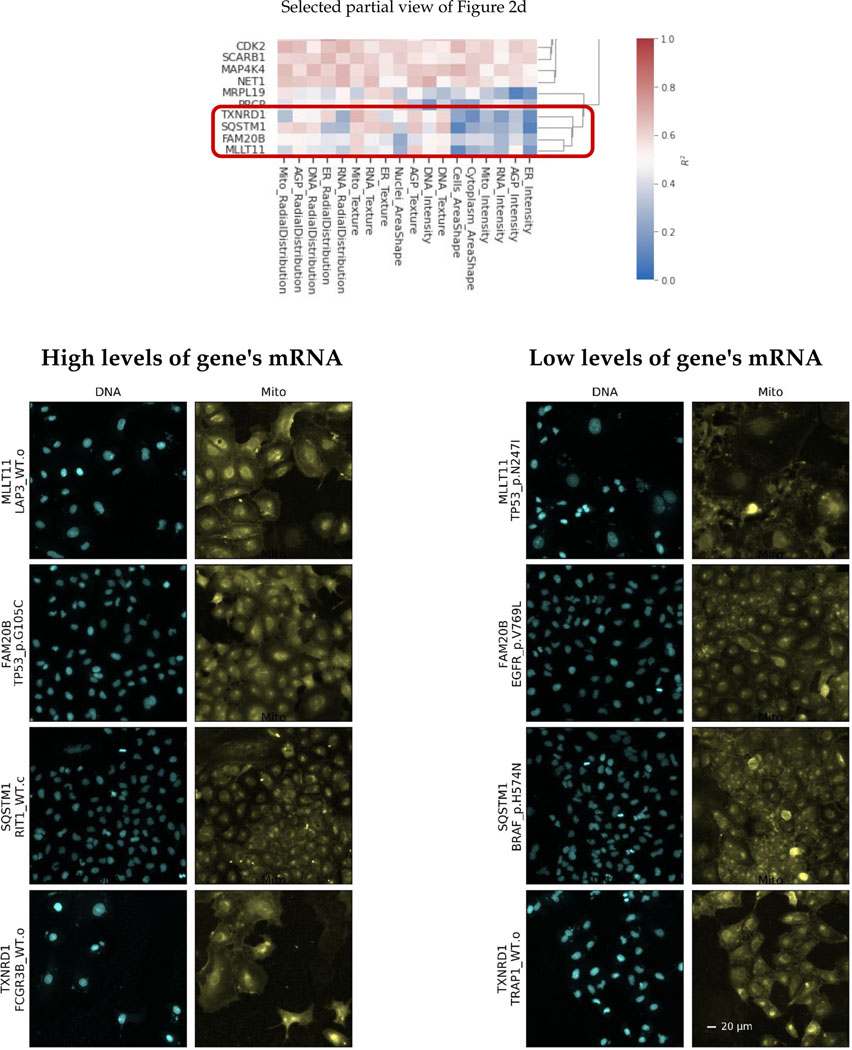
Extended Data Fig. 4. Visualization of cells in a cluster of landmark genes that are tightly correlated with RNA texture category of morphological features.
For the cluster of landmark genes shown in the top heatmap, which is a partial snapshot of figure 2d, we have shown example cell images for perturbations that have high and low predicted values for each gene in that cluster. We have filtered perturbations to those that have low prediction errors prior to that selection. We can observe that cells that are predicted to have (and actually do have) high levels of these five genes’ mRNA all are associated with visible changes in the staining for mitochondria, even though only half of these genes already have functional annotations related to the mitochondria.

