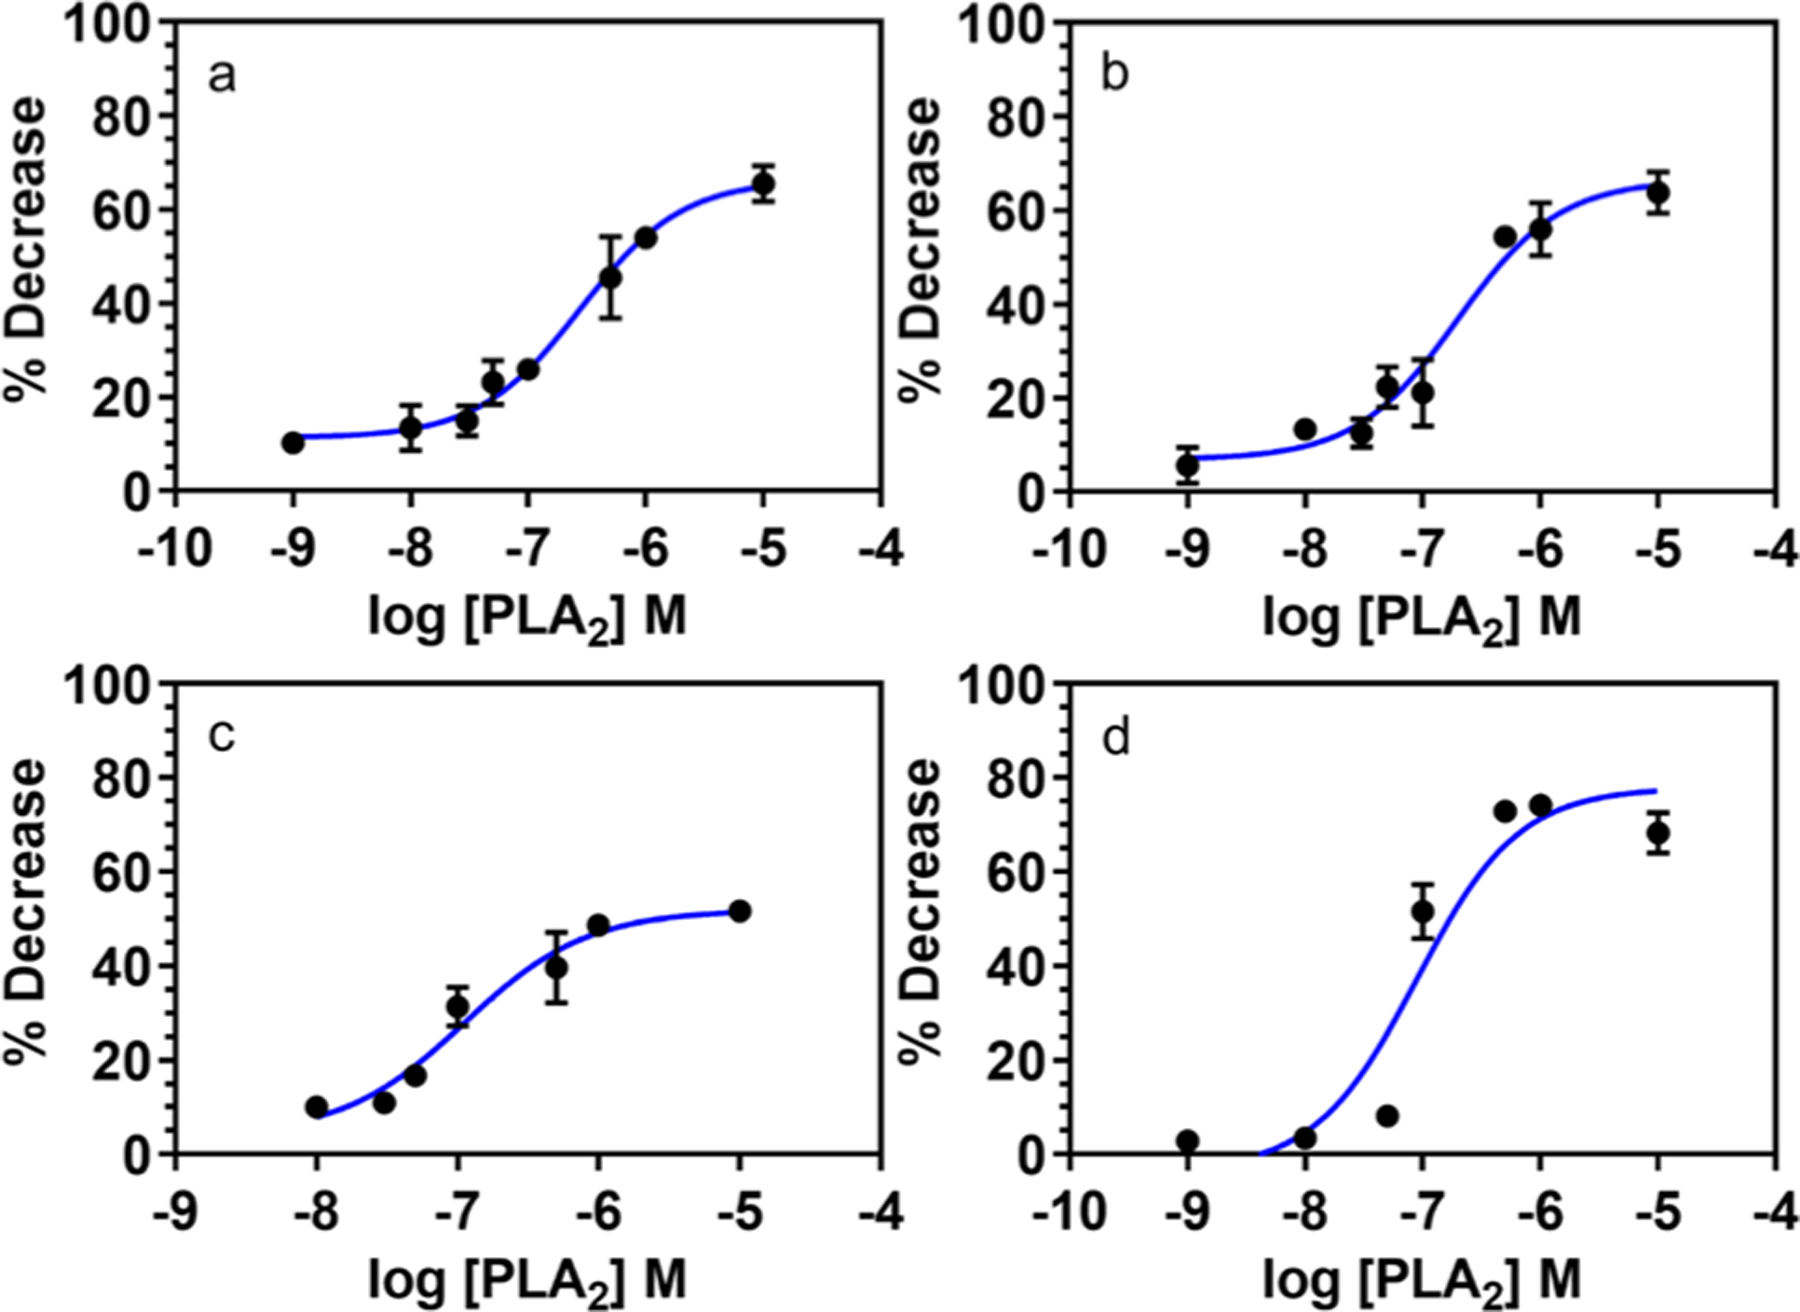
Figure 3.

Dose–response curves for PLA2 interaction on different lipo-beads at the liquid phase of the primary constituent lipid. (a) DMPC, (b) PC, (c) 20:80 DMPG/DMPC, and (d) 100:1 DMPC/RPE. The PLA2 activity was measured as the percent decrease of fluorescence intensity of lipo-beads after reacting with PLA2 at different concentrations ranging from 1 nM to 10 μM, except for (c) where the range is from 10 nM to 10 μM.
