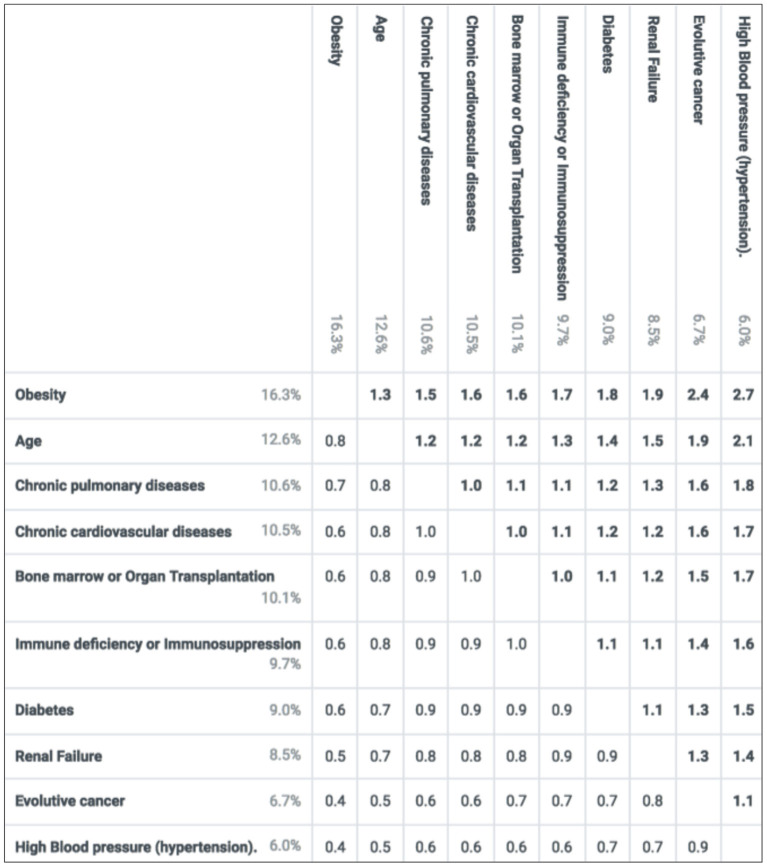
Figure 3.
Relative importance of the criteria. Based on the mean preference values, each number in the table is a ratio corresponding to the importance of the criterion on the left relative to the criterion at the top. The ratios are obtained by dividing the left preference values by the top preference values.

