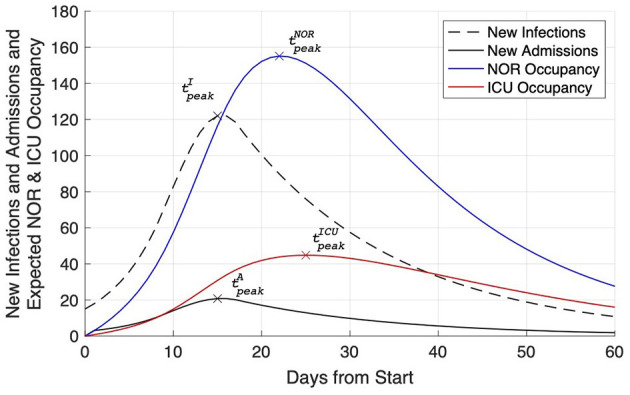
Figure 3.

Expected NOR (blue line) and ICU (red line) occupancy due to a notional number of newly admitted Covid-19 patients. Additionally, the number of new infections (dashed black line) and the derived number of new hospital admissions (solid black line) are plotted. For each line the time of peak is indicated.
