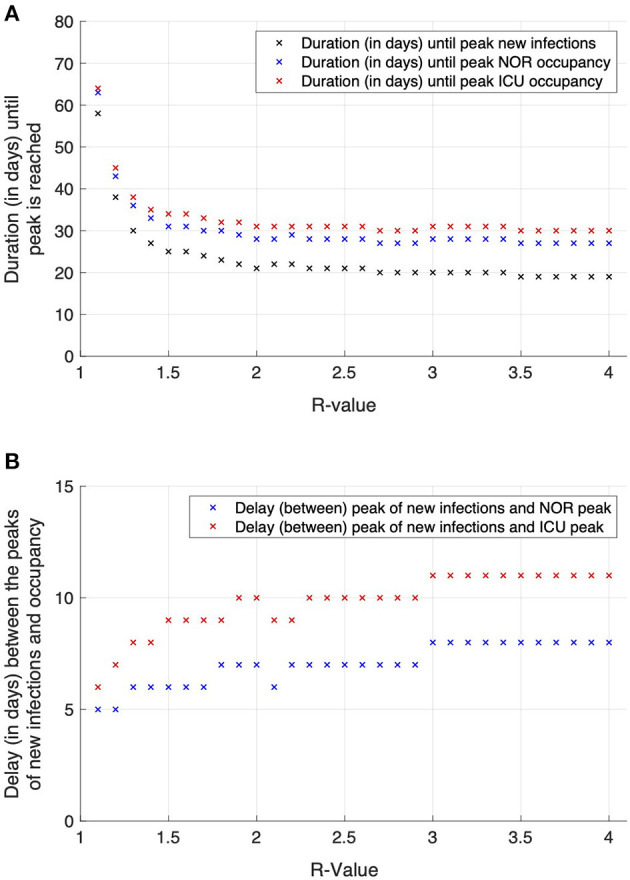
Figure 4.

Effects of varying R-values on the time to peak for new infections and NOR and ICU occupancy (A) and delay between these two measures (B). The higher the R-values, the earlier the peaks in the course of the simulation occur (A). Contrastingly, the delay in time between the occurrence of the infection peak and the occupancy peaks for the NOR (red marks) and ICU (blue marks) enlarges with increasing R-value (B).
