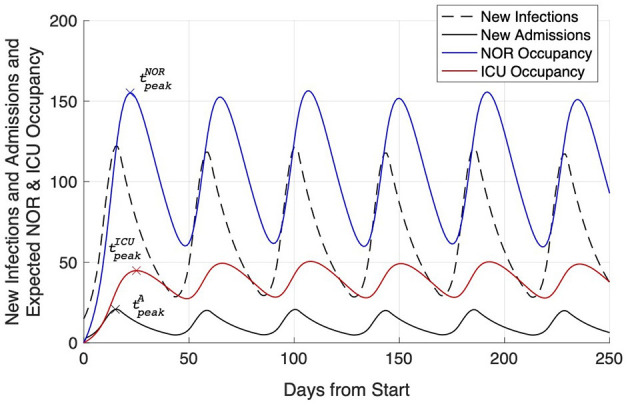
Figure 5.

Simulation of the effects of mitigation measures affecting the current R-value: new infections (dashed black line), new hospitalizations (solid black line), and expected NOR (blue line) and ICU (red line) occupancy caused by short term measures, i.e., in this case measures that were stopped already 5 days after the 7-days incidence returned below the level of 50.
