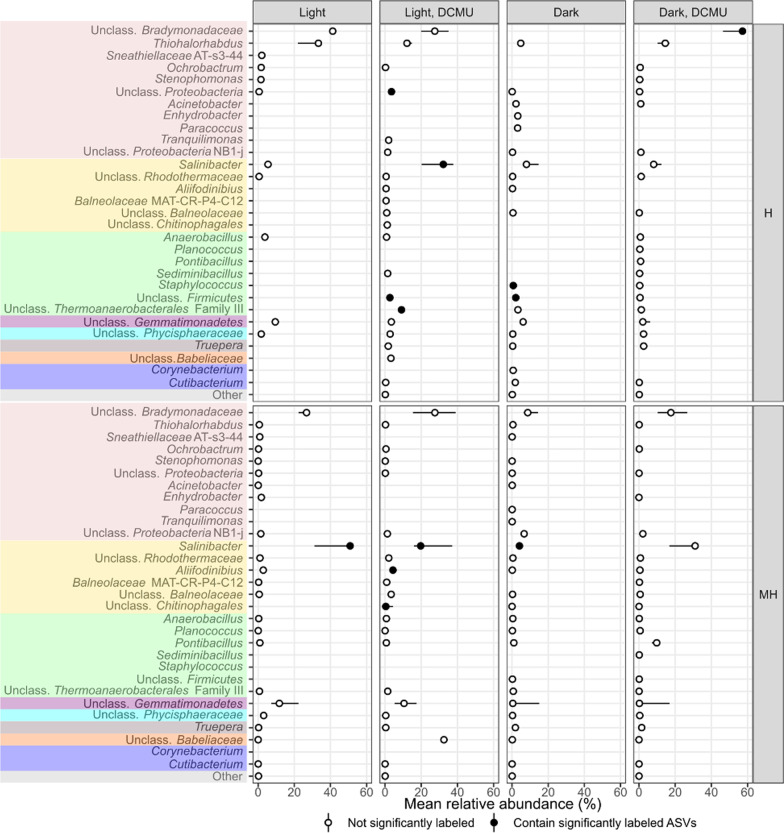
Fig. 5.
Point-range plot showing the median relative abundance (n = 3, points) and 50% confidence interval error bars (lines) of bacterial taxa comprising more than 1% of the reads in any treatment and heavy pooled fractions (medium heavy, MH, and heavy, H) at the genus level (or closest possible classification). Filled points indicate that at least one representative of a particular taxa was identified as significantly labeled. Colors represent different phyla –from top to bottom: Pseudomonadota, Bacteroidota, Bacillota, Gemmatimonadota, Planctomycetota, Deinococcota, Candidatus Dependentiae, Actinomycetota

