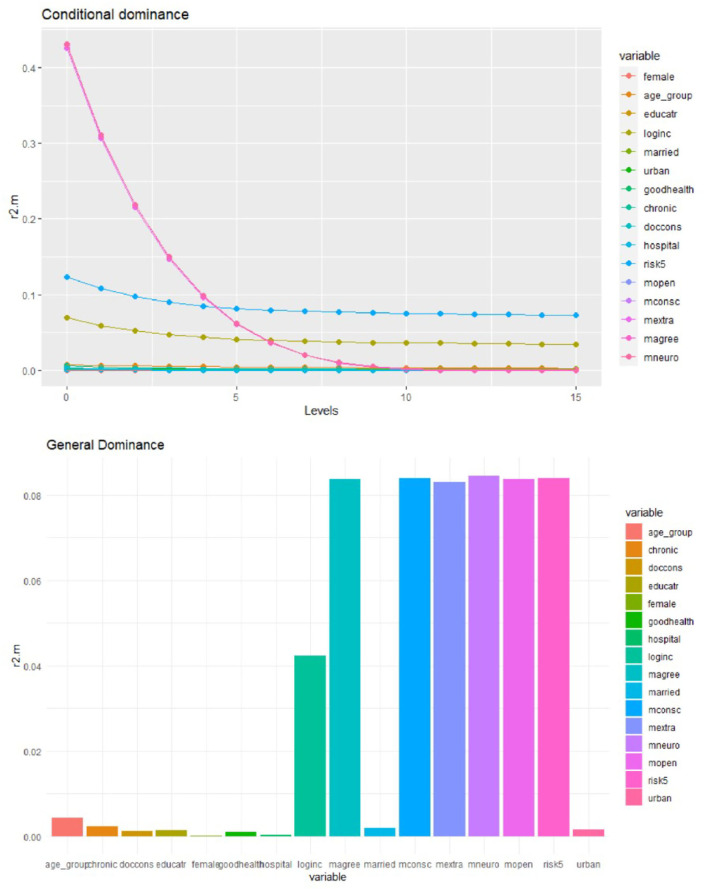
Figure 5.
Conditional and general dominance for choice of alternative health plan. Swiss Household Panel (SHP), own calculations. The figure shows the contributions of predictors by levels (conditional dominance) and the average contribution (general dominance) of the predictors for the choice of alternative health plan, using McFadden R2 as the analog of R2. Conditional dominance statistics and general dominance statistics are displayed on the vertical axes. High values correspond to high levels of contributions, thus being more dominant across all model sizes [for more information, see (41)].

