
Figure 3.
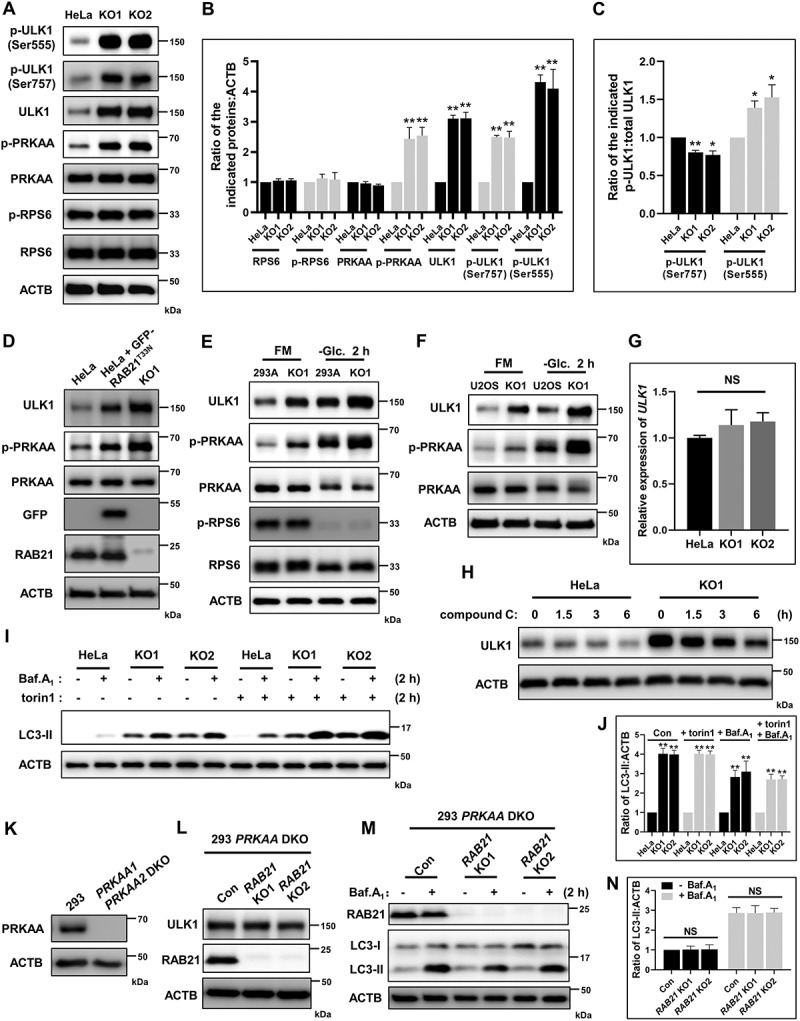
RAB21 KO activates the AMPK-ULK1 pathway. (A-C) Immunoblot analysis of RPS6, p-RPS6, PRKAA, p-PRKAA, ULK1, p-ULK1 (Ser555), p-ULK1 (Ser757) and ACTB using whole-cell lysates of WT and RAB21 KO HeLa cells. The quantitative results from three independent experiments are shown in B and C. (D) Immunoblot analysis of PRKAA, p-PRKAA, ULK1, GFP, RAB21 and ACTB in WT, GFP-RAB21T33N-expressing and RAB21 KO HeLa cells. (E) WT and RAB21 KO 293A cells were cultured in FM or -Glc. followed by immunoblot analysis with the indicated antibodies. (F) WT and RAB21 KO U2OS cells were cultured in FM or -Glc. followed by immunoblot analysis with the indicated antibodies. (G) mRNA levels of ULK1 in WT and RAB21 KO HeLa cells were determined by quantitative RT-PCR. (H) WT and RAB21 KO HeLa cells were treated with 10 μM compound C for the indicated time points and then lysed for immunoblot analysis of ULK1. (I-J) WT and RAB21 KO HeLa cells were treated with Baf.A1 (100 nM), torin1 (250 nM), or Baf.A1 plus torin1 and then lysed for immunoblot analysis of LC3. The quantitative results from three independent experiments are shown in J. (K) WT and PRKAA1 PRKAA2 double-KO (DKO) 293 cells were immunoblotted for PRKAA. (L) PRKAA1 PRKAA2 DKO and PRKAA1 PRKAA2 and RAB21 triple KO (RAB21 KO1, RAB21 KO2) 293 cells were lysed for immunoblot analysis with the indicated antibodies. (M-N) the same cells as shown in L were cultured in the presence or absence of 100 nM Baf.A1 and lysed for immunoblot analysis with the indicated antibodies. The quantitative results from three independent experiments are shown in N. The graphs express the mean ± SEM. *P <0.05; **P <0.01; NS, not significant.