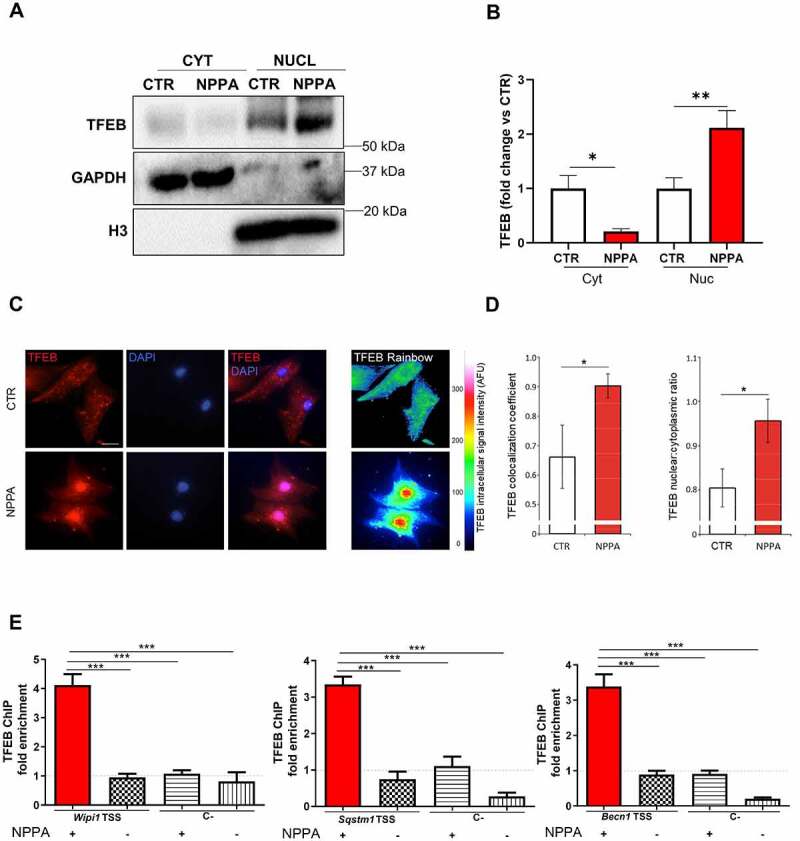
Figure 7.

NPPA induced the nuclear translocation of transcription factor EB (TFEB) in cardiomyocytes. (A–E) CMs were treated with 10−11 M NPPA for 4 h to evaluate cytoplasm (cyt) and nuclear (nuc) expression of TFEB. (A–B) Representative western blot and corresponding densitometric analysis. Cytoplasm and nuclear expression of TFEB were normalized with GAPDH and histone 3 (H3) levels, respectively. Values are expressed as mean ±SEM (N=5) *p<0.05; **p<0.01 obtained by using the one-way ANOVA followed by Bonferroni’s Multiple Comparison Test. (C) Representative images show the colocalization of TFEB (red) and DAPI (blue) in NPPA-treated CMs and the intracellular intensity of TFEB signal in untreated and treated cells (Rainbow scale of pseudocolor). Scale bar: 20 μm. (D) the columns represent the correlation coefficient and the nuclear:cytoplasmic ratio of TFEB. Values are expressed as mean ±SEM (N=4). *p<0.0001 was obtained by Student T test. (E) Quantification of chromatin immunoprecipitation for TFEB binding to the transcriptional starting site (TSS) of Wipi1, Sqstm1 and Becn1 genes, using the anti-TFEB antibody, in H9c2 cells treated without or with NPPA. Regions 2.5–4 Kb upstream to the TSS of Wipi1, Sqstm1 and Becn1 were used as negative controls of TFEB binding (C-). Data are mean fold increases ± SEM (N=4). ***p < 0.001 was obtained by Student T test.
