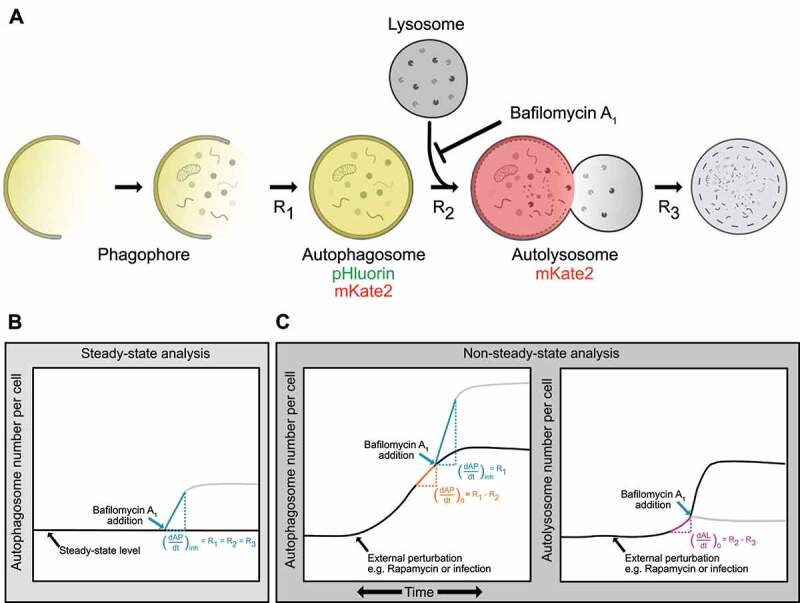
Figure 1.

Conceptual framework of non-steady-state analysis of autophagy rates. (A) Phagophores expand to form autophagosomes. Autophagosomes fuse with lysosomes to form autolysosomes. Contents are degraded in autolysosomes. The rates of each of these steps (R1, R2, and R3) can be measured using a mass action model and live-cell imaging. Fluorescently tagged LC3 (pHluorin-mKate2-LC3) can be used to quantify autophagosomes (pHluorin- and mKate2-positive) and autolysosomes (mKate2-positive, pHluorin is quenched at low pH). (B) Measurement of autophagosome numbers following inhibition of autophagosome-lysosome fusion using bafilomycin A1 allows for measurement of R1, the rate of autophagosome formation. When performed at a steady-state, this rate is equal to the other rates in the pathway. (C) When changes in autophagosome and autolysosome numbers are measured using an instantaneous rate approach, all rates in the autophagy pathway (R1, R2, and R3), which may not be equal under dynamic conditions, can be measured.
