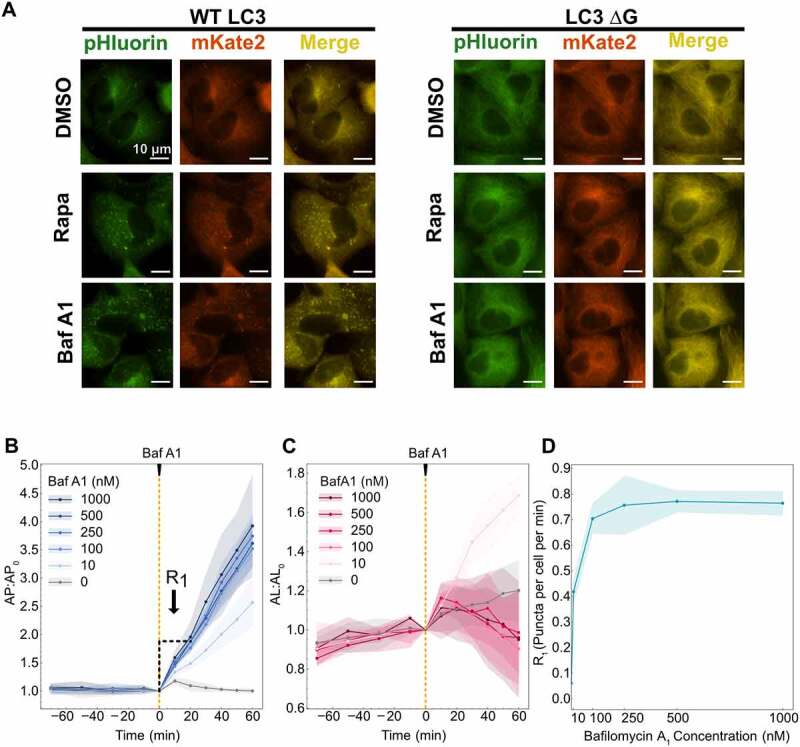
Figure 2.

Calibration of system conditions for data collection. (A) Images of cells expressing the pHluorin-mKate2-LC3 tandem fluorescent reporter following DMSO, 100 nM rapamycin (Rapa) and 500 nM bafilomycin A1 (Baf A1) treatment. WT LC3 represent wild type and LC3 ΔG was used as a negative control because this mutant cannot be lipidated for phagophore association. (B) Autophagosomes and (C) autolysosomes were quantified over 90 min before addition of bafilomycin A1 and 60 min after. R1 was calculated using the first 20 min of data following bafilomycin A1 treatment. (D) R1 rates are plotted as a function of bafilomycin A1 concentration. At least 150–200 cells were imaged for all experiments.
