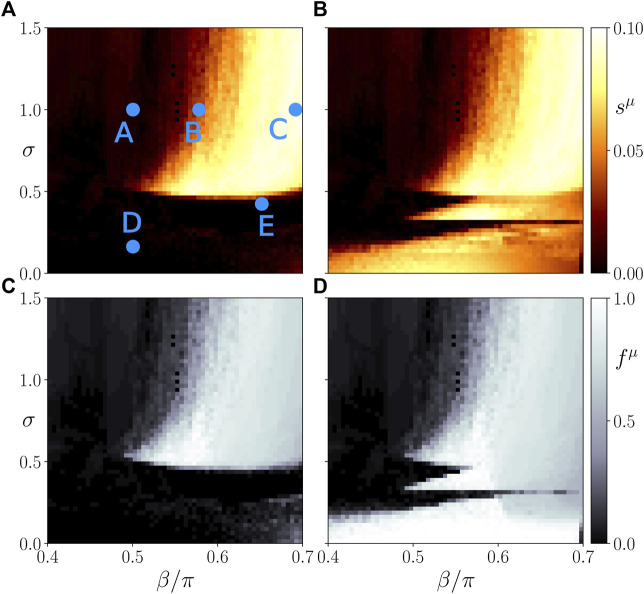
FIGURE 4.
Map of regimes: ensemble average s μ of the standard deviation of the spatially averaged mean phase velocities (A,B) and the frequency cluster ratio (C,D) in the parameter plane of age parameter β and interlayer coupling strength σ for the parenchymal (A,C) and immune layer (B,D), respectively. Bright colors correspond to the formation of frequency clusters. Simulation parameters: N = 200, α 11 = α 22 = −0.28π, α 12 = α 21 = 0, , ϵ 1 = 0.03, ϵ 2 = 0.3, ω 1 = ω 2 = 0, C = 40. Ensemble size is N E = 50. The simulation time is 2000 time units, the averaging time window 1000.

