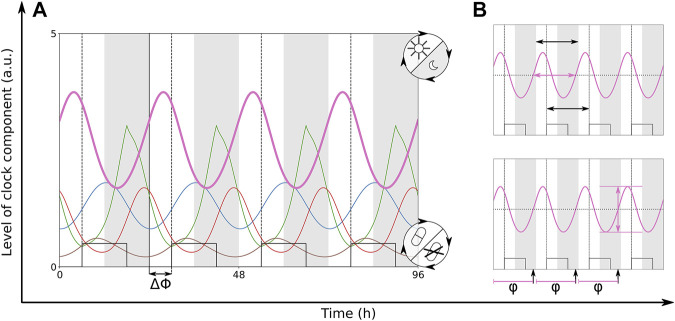
FIGURE 4.
(A) Time traces of the modified Korenčič model, which is entrained to two coexisting zeitgebers with periods of 24 h. Dark phases are indicated via grey bars and drug level is shown as square wave. There is a phase difference ΔΦ = 6 h between zeitgeber onsets. (B) The small graphs illustrate the frequency locking at a period of 24 h (black horizontal arrows), the resulting amplitude of Per (pink vertical arrow) and the phase φ (black vertical arrows) which is measured when the rising Per level is crossing the mean Per level. Light is turned on within the white bars. The solid, black vertical line highlights the onset of light. Dashed, black vertical lines highlight the onset of drug presence. Colours of the clock components are given in Figure 2.

