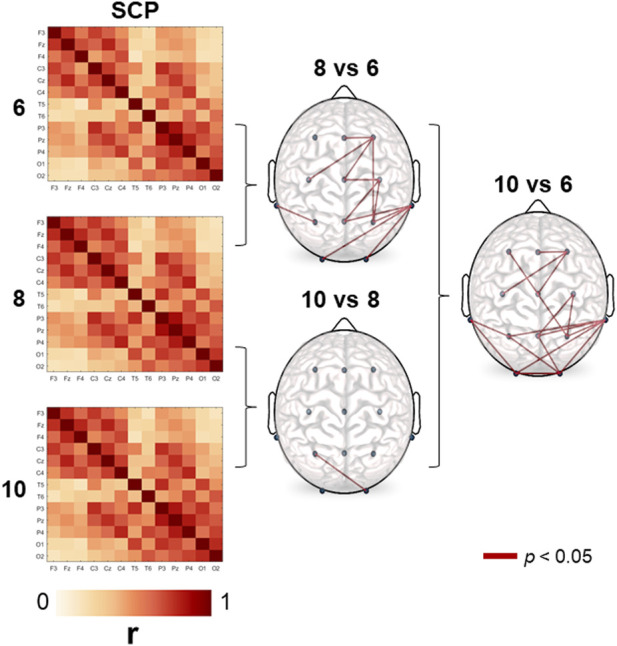
FIGURE 1.

Stable correlation pattern (SCP) for each age group. Connection lines indicate the age-significant differences (6, 8, and 10-year-old) in cross-correlation values on a 5% significance level according to the t-test. Correlation estimates turn out to be systematically higher in the older group in all comparisons.
