
FIGURE 2.
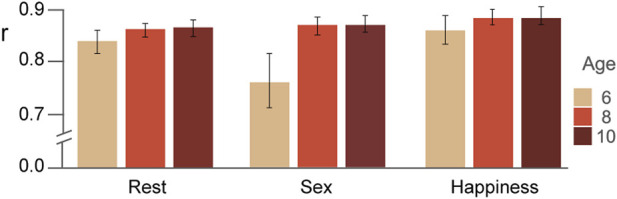
Similarity estimated via Pearson correlations (mean and standard errors) between the stable pattern and the average correlation matrix of each condition and for each age group are displayed.
Official websites use .gov
A
.gov website belongs to an official
government organization in the United States.
Secure .gov websites use HTTPS
A lock (
) or https:// means you've safely
connected to the .gov website. Share sensitive
information only on official, secure websites.
Similarity estimated via Pearson correlations (mean and standard errors) between the stable pattern and the average correlation matrix of each condition and for each age group are displayed.