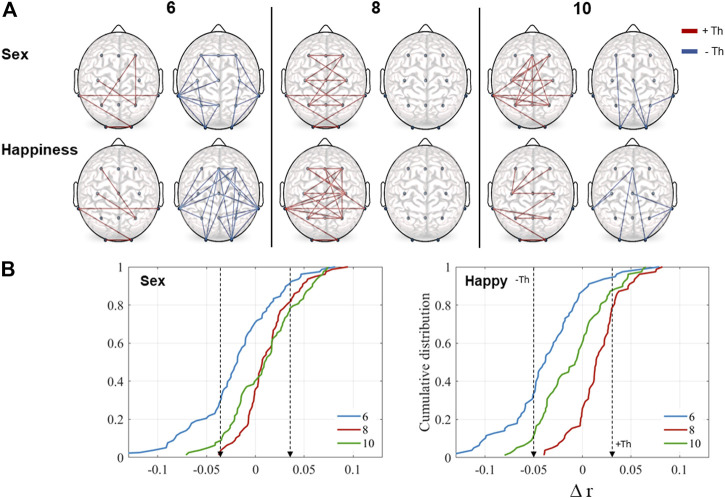
FIGURE 3.
(A) Representation of task-to-rest subtraction in correlation values ( . Edges are traced when surpassed the positive and negative thresholds. Red lines indicate an increase in correlation values and the negative ones a decrease. For sex condition: and . For happiness: and . (B) Age differences in cumulative distribution curves of task-to-rest subtraction for each task. Dotted arrows indicate the thresholds used for tracing the graphs.

