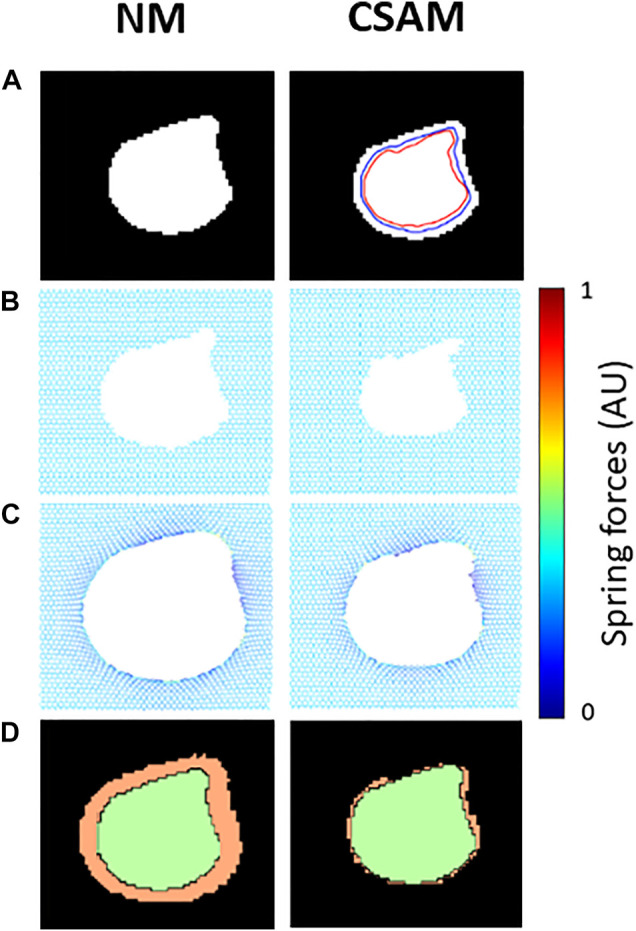
FIGURE 1.

Examples of mapping a synthetic low attenuation area (LAA) cluster onto spring networks using the naïve method (NM) and the Curvature and Size Adjusted Method (CSAM). (A) Binary image of the LAA. Blue and red lines represent respectively the size and curvature steps of the CSAM. (B) Removal of springs in a prestressed elastic network. (C) Configuration of the networks after solving for mechanical equilibrium. Note that dark blue and yellow represent low, and high mechanical force on springs. (D) Comparison of the reconstructed LAAs (green) and the original LAA (orange).
